Jenkins Pipeline for Ionic and Angular with Github and Bitbucket

Ionic is one of the best mobile app development frameworks available in the market today. Most of the organizations in recent world are using Jenkins as a great tool for automating build processes, continuous integration and automated deployment. Jenkins helps organizations automate every aspect of the development and save the developers precious time. This post also demonstrates how to use GitHub and Bitbucket pipeline for continuous integration and deployment of Ionic app.

Jenkins Pipeline for Ionic with Bitbucket

Read more ยป

Measuring SEO Performance After "Not Provided"

In recent years, the biggest change to the search landscape happened when Google chose to withhold keyword data from webmasters. At SEOBook, Aaron noticed and wrote about the change, as evermore keyword data disappeared.

The motivation to withold this data, according to Google, was privacy concerns:

SSL encryption on the web has been growing by leaps and bounds. As part of our commitment to provide a more secure online experience, today we announced that SSL Search on https://www.google.com will become the default experience for signed in users on google.com.

At first, Google suggested it would only affect a single-digit percentage of search referral data:

Google software engineer Matt Cutts, who’s been involved with the privacy changes, wouldn’t give an exact figure but told me he estimated even at full roll-out, this would still be in the single-digit percentages of all Google searchers on Google.com

…which didn’t turn out to be the case. It now affects almost all keyword referral data from Google.

Was it all about privacy? Another rocket over the SEO bows? Bit of both? Probably. In any case, the search landscape was irrevocably changed. Instead of being shown the keyword term the searcher had used to find a page, webmasters were given the less than helpful “not provided”. This change rocked SEO. The SEO world, up until that point, had been built on keywords. SEOs choose a keyword. They rank for the keyword. They track click-thrus against this keyword. This is how many SEOs proved their worth to clients.

These days, very little keyword data is available from Google. There certainly isn’t enough to keyword data to use as a primary form of measurement.

Rethinking Measurement

This change forced a rethink about measurement, and SEO in general. Whilst there is still some keyword data available from the likes of Webmaster Tools & the AdWords paid versus organic report, keyword-based SEO tracking approaches are unlikely to align with Google’s future plans. As we saw with the Hummingbird algorithm, Google is moving towards searcher-intent based search, as opposed to keyword-matched results.

Hummingbird should better focus on the meaning behind the words. It may better understand the actual location of your home, if you’ve shared that with Google. It might understand that “place” means you want a brick-and-mortar store. It might get that “iPhone 5s” is a particular type of electronic device carried by certain stores. Knowing all these meanings may help Google go beyond just finding pages with matching words

The search bar is still keyword based, but Google is also trying to figure out what user intent lays behind the keyword. To do this, they’re relying on context data. For example, they look at what previous searches has the user made, their location, they are breaking down the query itself, and so on, all of which can change the search results the user sees.

When SEO started, it was in an environment where the keyword the user typed into a search bar was exact matching that with a keyword that appears on a page. This is what relevance meant. SEO continued with this model, but it’s fast becoming redundant, because Google is increasingly relying on context in order to determine searcher intent & while filtering many results which were too aligned with the old strategy. Much SEO has shifted from keywords to wider digital marketing considerations, such as what the visitor does next, as a result.

We’ve Still Got Great Data

Okay, if SEO’s don’t have keywords, what can they use?

If we step back a bit, what we’re really trying to do with measurement is demonstrate value. Value of search vs other channels, and value of specific search campaigns. Did our search campaigns meet our marketing goals and thus provide value?

Do we have enough data to demonstrate value? Yes, we do. Here are a few ideas SEOs have devised to look at the organic search data they are getting, and they use it to demonstrate value.

1. Organic Search VS Other Activity

If our organic search tracking well when compared with other digital marketing channels, such as social or email? About the same? Falling?

In many ways, the withholding of keyword data can be a blessing, especially to those SEOs who have a few ranking-obsessed clients. A ranking, in itself is worthless, especially if it’s generating no traffic.

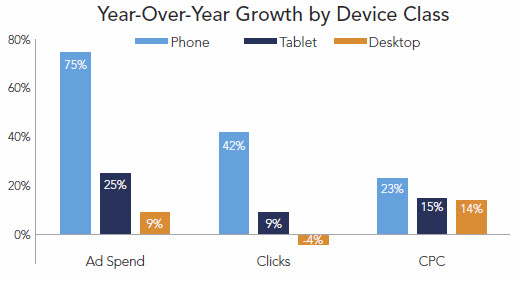
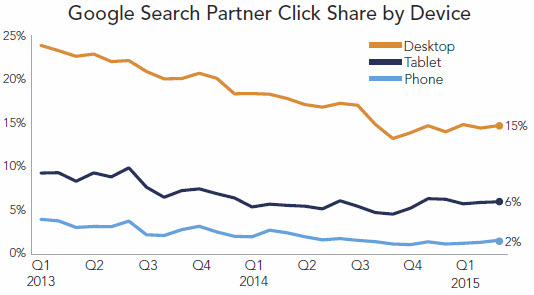
Instead, if we look at the total amount of organic traffic, and see that it is rising, then we shouldn’t really care too much about what keywords it is coming from. We can also track organic searches across device, such as desktop vs mobile, and get some insight into how best to optimize those channels for search as a whole, rather than by keyword. It’s important that the traffic came from organic search, rather than from other campaigns. It’s important that the visitors saw your site. And it’s important what that traffic does next.

2. Bounce Rate

If a visitor comes in, doesn’t like what is on offer, and clicks back, then that won’t help rankings. Google have been a little oblique on this point, saying they aren’t measuring bounce rate, but I suspect it’s a little more nuanced, in practice. If people are failing to engage, then anecdotal evidence suggests this does affect rankings.

Look at the behavioral metrics in GA; if your content has 50% of people spending less than 10 seconds, that may be a problem or that may be normal. The key is to look below that top graph and see if you have a bell curve or if the next largest segment is the 11-30 second crowd.

Either way, we must encourage visitor engagement. Even small improvements in terms of engagement can mean big changes in the bottom line. Getting visitors to a site was only ever the first step in a long chain. It’s what they do next that really makes or breaks a web business, unless the entire goal was that the visitor should only view the landing page. Few sites, these days, would get much return on non-engagement.

PPCers are naturally obsessed with this metric, because each click is costing them money, but when you think about it, it’s costing SEOs money, too. Clicks are getting harder and harder to get, and each click does have a cost associated with it i.e. the total cost of the SEO campaign divided by the number of clicks, so each click needs to be treated as a cost.

3. Landing Pages
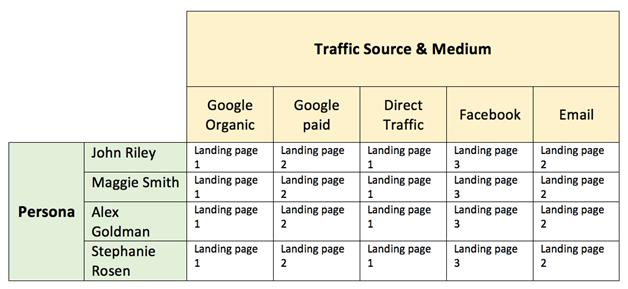
We can still do landing page analysis. We can see the pages where visitors are entering the website. We can also see which pages are most popular, and we can tell from the topic of the page what type of keywords people are using to find it.

We could add more related keyword to these pages and see how they do, or create more pages on similar themes, using different keyword terms, and then monitor the response. Similarly, we can look at poorly performing pages and make the assumption these are not ranking against intended keywords, and mark these for improvement or deletion.

We can see how old pages vs new pages are performing in organic search. How quickly do new pages get traffic?

We’re still getting a lot of actionable data, and still not one keyword in sight.

4. Visitor And Customer Acquisition Value

We can still calculate the value to the business of an organic visitor.

We can also look at what step in the process are organic visitors converting. Early? Late? Why? Is there some content on the site that is leading them to convert better than other content? We can still determine if organic search provided a last click-conversion, or a conversion as the result of a mix of channels, where organic played a part. We can do all of this from aggregated organic search data, with no need to look at keywords.

5. Contrast With PPC

We can contrast Adwords data back against organic search. Trends we see in PPC might also be working in organic search.

For AdWords our life is made infinitesimally easier because by linking your AdWords account to your Analytics account rich AdWords data shows up automagically allowing you to have an end-to-end view of campaign performance.

Even PPC-ers are having to change their game around keywords:

The silver lining in all this? With voice an mobile search, you’ll likely catch those conversions that you hadn’t before. While you may think that you have everything figured out and that your campaigns are optimal, this matching will force you into deeper dives that hopefully uncover profitable PPC pockets.

6. Benchmark Against Everything

In the above section I highlighted comparing organic search to AdWords performance, but you can benchmark against almost any form of data.

Is 90% of your keyword data (not provided)? Then you can look at the 10% which is provided to estimate performance on the other 90% of the traffic. If you get 1,000 monthly keyword visits for [widgets], then as a rough rule of thumb you might get roughly 9,000 monthly visits for that same keyword shown as (not provided).

Has your search traffic gone up or down over the past few years? Are there seasonal patterns that drive user behavior? How important is the mobile shift in your market? What landing pages have performed the best over time and which have fallen hardest?

How is your site’s aggregate keyword ranking profile compared to top competitors? Even if you don’t have all the individual keyword referral data from search engines, seeing the aggregate footprints, and how they change over time, indicates who is doing better and who gaining exposure vs losing it.

Numerous competitive research tools like SEM Rush, SpyFu & SearchMetrics provide access to that type of data.

You can also go further with other competitive research tools which look beyond the search channel. Is most of your traffic driven from organic search? Do your competitors do more with other channels? A number of sites like Compete.com and Alexa have provided estimates for this sort of data. Another newer entrant into this market is SimilarWeb.

And, finally, rank checking still has some value. While rank tracking may seem futile in the age of search personalization and Hummingbird, it can still help you isolate performance issues during algorithm updates. There are a wide variety of options from browser plugins to desktop software to hosted solutions.

By now, I hope I’ve convinced you that specific keyword data isn’t necessary and, in some case, may have only served to distract some SEOs from seeing other valuable marketing metrics, such as what happens after the click and where do they go next.

So long as the organic search traffic is doing what we want it to, we know which pages it is coming in on, and can track what it does next, there is plenty of data there to keep us busy. Lack of keyword data is a pain, but in response, many SEOs are optimizing for a lot more than keywords, and focusing more on broader marketing concerns.

Further Reading & Sources:

Categories: 

Powered by WPeMatico

Google SEO Services (BETA)

When Google acquired DoubleClick Larry Page wanted to keep the Performics division offering SEM & SEO services just to see what would happen. Other Google executives realized the absurd conflict of interest and potential anti trust issues, so they overrode ambitious Larry: “He wanted to see how those things work. He wanted to experiment.”

Webmasters have grown tired of Google’s duplicity as the search ecosystem shifts to pay to play, or go away.

@davidiwanow I understand the problem, just not the complaints. Google won. Find another oppty, or pay Google. Simple.— john andrews (@searchsleuth999) November 5, 2014

Google’s webmaster guidelines can be viewed as reasonable and consistent or as an anti-competitive tool. As Google eats the ecosystem, those thrown under the bus shift their perspective.

Scraping? AOG (unless we do it) Affiliate? Fucking scumbags mainly AOG (unless we get into the space) Thin content? AOG (unless we do it)— Rae Hoffman (@sugarrae) November 5, 2014

Within some sectors larger players can repeatedly get scrutiny for the same offense with essentially no response, whereas smaller players operating in that same market are slaughtered because they are small.

At this point, Google should just come out and be blunt, “any form of promotion that does not involve paying us is against our guidelines.”— Rae Hoffman (@sugarrae) November 5, 2014

Access to lawyers, politicians & media outlets = access to benefit of the doubt.

Lack those & BEST OF LUCK TO YOU ๐Ÿ˜‰

And most of all, I’m tired of having to tell SMBs that Google gives zero fucks when it comes to them— Rae Hoffman (@sugarrae) November 5, 2014

Google’s page asking “Do you need an SEO?” uses terms like: scam, illicit and deceptive to help frame the broader market perception of SEO.

If ranking movements appear random & non-linear then it is hard to make sense of continued ongoing investment. The less stable Google makes the search ecosystem, the worse they make SEOs look, as…

  • anytime a site ranks better, that anchors the baseline expectation of where rankings should be
  • large rank swings create friction in managing client communications
  • whenever search traffic falls drastically it creates real world impacts on margins, employment & inventory levels

Matt Cutts stated it is a waste of resources for him to be a personal lightning rod for criticism from black hat SEOs. When Matt mentioned he might not go back to his old role at Google some members of the SEO industry were glad. In response some other SEOs mentioned black hats have nobody to blame but themselves & it is their fault for automating things.

After all, it is not like Google arbitrarily shifts their guidelines overnight and drastically penalizes websites to a disproportionate degree ex-post-facto for the work of former employees, former contractors, mistaken/incorrect presumed intent, third party negative SEO efforts, etc.

Oh … wait … let me take that back.

Indeed Google DOES do that, which is where much of the negative sentiment Matt complained about comes from.

Recall when Google went after guest posts, a site which had a single useful guest post on it got a sitewide penalty.

Around that time it was noted Auction.com had thousands of search results for text which was in some of their guest posts.

Enjoying Aaron murdering http://t.co/UadnmwekM7 RT @aaronwall: “about 9,730 results” http://t.co/Sms5L2BFGY— Brian Provost (@brianprovost) April 9, 2014

About a month before the guest post crack down, Auction.com received a $50 million investment from Google Capital.

  • Publish a single guest post on your site = Google engineers shoot & ask questions later.
  • Publish a duplicated guest post on many websites, with Google investment = Google engineers see it as a safe, sound, measured, reasonable, effective, clean, whitehat strategy.

The point of highlighting that sort of disconnect was not to “out” someone, but rather to highlight the (il)legitimacy of the selective enforcement. After all, …

@mvandemar @brianprovost if anyone should have the capital needed to “do things the right way, as per G” it should be G & those G invests in— aaron wall (@aaronwall) April 9, 2014

But perhaps Google has decided to change their practices and have a more reasonable approach to the SEO industry.

An encouraging development on this front was when Auction.com was once again covered in Bloomberg. They not only benefited from leveraging Google’s data and money, but Google also offered them another assist:

Closely held Auction.com, which is valued at $1.2 billion, based on Google’s stake, also is working with the Internet company to develop mobile and Web applications and improve its search-engine optimization for marketing, Sharga said.

“In a capitalist system, [Larry Page] suggests, the elimination of inefficiency through technology has to be pursued to its logical conclusion.” ― Richard Waters

With that in mind, one can be certain Google didn’t “miss” the guest posts by Auction.com. Enforcement is selective, as always.

“The best way to control the opposition is to lead it ourselves.” ― Vladimir Lenin

Whether you turn left or right, the road leads to the same goal.

Categories: 

Powered by WPeMatico

But First, A Word From Our Sponsors…

Yesterday Google shared they see greater mobile than desktop search volumes in 10 countries including Japan and the United States.

3 years ago RKG shared CTR data which highlighted how mobile search ads were getting over double the CTR as desktop search ads.

The basic formula: less screen real estate = higher proportion of user clicks on ads.

Google made a big deal of their “mobilepocalypse” update to scare other webmasters into making their sites mobile friendly. Part of the goal of making sites “mobile friendly” is to ensure it isn’t too ad dense (which in turn lowers accidental ad clicks & lowers monetization). Not only does Google have an “ad heavy” relevancy algorithm which demotes ad heavy sites, but they also explicitly claim even using a moderate sized ad unit on mobile devices above the fold is against their policy guidelines:

Is placing a 300×250 ad unit on top of a high-end mobile optimized page considered a policy violation?

Yes, this would be considered a policy violation as it falls under our ad placement policies for site layout that pushes content below the fold. This implementation would take up too much space on a mobile optimized site’s first view screen with ads and provides a poor experience to users. Always try to think of the users experience on your site – this will help ensure that users continue to visit.

So if you make your site mobile friendly you can’t run Google ads above the fold unless you are a large enough publisher that the guidelines don’t actually matter.

If you spend the extra money to make your site mobile friendly, you then must also go out of your way to lower your income.

What is the goal of the above sort of scenario? Defunding content publishers to ensure most the ad revenues flow to Google.

If you think otherwise, consider the layout of the auto ads & hotel ads Google announced yesterday. Top of the search results, larger than 300×250.

If you do X, you are a spammer. If Google does X, they are improving the user experience.

@aaronwall they will personally do everything they penalize others for doing; penalties are just another way to weaken the market.— Cygnus SEO (@CygnusSEO) May 5, 2015

The above sort of contrast is something noticed by non-SEOs. The WSJ article about Google’s new ad units had a user response stating:

With this strategy, Google has made the mistake of an egregious use of precious mobile screen space in search results. This entails much extra fingering/scrolling to acquire useful results and bypass often not-needed coincident advertising. Perhaps a moneymaker by brute force; not a good idea for utility’s sake.

That content displacement with ads is both against Google’s guidelines and algorithmically targeted for demotion – unless you are Google.

How is that working for Google partners?

According to eMarketer, by 2019 mobile will account for 72% of US digital ad spend. Almost all that growth in ad spend flows into the big ad networks while other online publishers struggle to monetize their audiences:

Facebook and Google accounted for a majority of mobile ad market growth worldwide last year. Combined, the two companies saw net mobile ad revenues increase by $6.92 billion, claiming 75.2% of the additional $9.2 billion that went toward mobile in 2013.

Back to the data RKG shared. Mobile is where the growth is…

…and the smaller the screen size the more partners are squeezed out of the ecosystem…

The high-intent, high-value search traffic is siphoned off by ads.

What does that leave for the rest of the ecosystem?

It is hard to build a sustainable business when you have to rely almost exclusively on traffic with no commercial intent.

One of the few areas that works well is perhaps with evergreen content which has little cost of maintenance, but even many of those pockets of opportunity are disappearing due to the combination of the Panda algorithm and Google’s scrape-n-displace knowledge graph.

.@mattcutts I think I have spotted one, Matt. Note the similarities in the content text: pic.twitter.com/uHux3rK57f— dan barker (@danbarker) February 27, 2014

Even companies with direct ad sales teams struggle to monetize mobile:

At The New York Times, for instance, more than half its digital audience comes from mobile, yet just 10% of its digital-ad revenue is attributed to these devices.

Other news websites also get the majority of their search traffic from mobile.

Why do news sites get so much mobile search traffic? A lot of it is navigational & beyond that most of it is on informational search queries which are hard to monetize (and thus have few search ads) and hard to structure into the knowledge graph (because they are about news items which only just recently happened).

If you look at the organic search traffic breakdown in your analytics account & you run a site which isn’t a news site you will likely see a far lower share of search traffic from mobile. Websites outside of the news vertical typically see far less mobile traffic. This goes back to Google dominating the mobile search interface with ads.

Mobile search ecosystem breakdown

  • traffic with commercial intent = heavy ads
  • limited commercial intent but easy answer = knowledge graph
  • limited commercial intent & hard to answer = traffic flows to news sites

Not only is Google monetizing a far higher share of mobile search traffic, but they are also aggressively increasing minimum bids.

As Google continues to gut the broader web publishing ecosystem, they can afford to throw a few hundred million in “innovation” bribery kickback slush funds. That will earn them some praise in the short term with some of the bigger publishers, but it will make those publishers more beholden to Google. And it is even worse for smaller publishers. It means the smaller publishers are not only competing against algorithmic brand bias, confirmation bias expressed in the remote rater documents, & wholesale result set displacement, but some of their bigger publishing competitors are also subsidized directly by Google.

Ignore the broader ecosystem shifts.

Ignore the hypocrisy.

Focus on the user.

Until you are eating cat food.

Categories: 

Powered by WPeMatico

The 4 Fundamental Steps of Conversion Optimization

Once upon a time, I was sitting in my office looking over data for one our new clients and reviewing the conversion project roadmap. The phone rang and on the other end was the VP of marketing for a multi-billion-dollar company. It is very unusual to get an unannounced call from someone at his level, but he had an urgent problem to solve. A good number of his website visitors were not converting.

His problem did not surprise me. We deal with conversion rates optimization every day.

He invited me to meet with his team to discuss the problem further. The account would be a huge win for Invesp, so we agreed on a time that worked for both us. When the day came, our team went to the company’s location.

We started the discussion, and things did NOT go as I expected. The VP, who led the meeting, said, “we have a conversion problem.”

“First-time visitors to our website convert at a rate of 48%. Repeat visitors convert at 80%!”

I was puzzled.

Not sure what exactly puzzled me. Was it the high conversion numbers or was it the fact that the VP was not happy with them. He wanted more.

I thought he had his conversion numbers wrong. But nope. We looked at his analytics, and he was correct. The numbers were simply amazing by all standards. The VP, however, had a different mindset. The company runs thousands of stores around the US. When someone picks up the phone and calls them, they convert callers at a 90% rate. He was expecting the same conversion rate for his online store.

Let’s face it. A typical e-commerce store converts at an average of 3%. Few websites are able to get to anywhere from 10 to 18%. These are considered the stars of the world of conversion rates.

The sad truth about a website with 15% conversion rate is that 85% of the visitors simply leave without converting. Money left on the table, cash the store will not be able to capture. Whatever way you think about it, we can agree that there is a huge opportunity, but it is also a very difficult one to conquer.

The Problem with Conversion Optimization

Most companies jump into conversion optimization with a lot of excitement. As you talk to teams conducting conversion optimization, you notice a common thread. They take different pages of the website and run tests on them. Some tests produce results; others do not. After a while, the teams run out of ideas. The managers run out of excitement.

The approach of randomly running tests on different pages sees conversion rate optimization in a linear fashion. The real problem is that no one shops online in a linear fashion. We do not follow a linear path when we navigate from one area of the website to the next. Humans most of the time are random, or, at least, they appear random.

What does that mean?

The right approach to increase conversion rates needs to be systematical, because it deals with irrational and random human behavior.

So, how do you do this?

The Four Steps to Breaking to Double Digits Conversion Rates

After ten years of doing conversion optimization at Invesp, I can claim that we have a process that works for many online businesses. The truth is that it continues to be a work in progress.

These are the four steps you should follow to achieve your desired conversion rate:

Create Personas for Your Website

I could never stop talking about personas and the impact they have on your website. While most companies talk about their target market, personas help you translate your generalized and somewhat abstract target market data into a personalized experience that impacts your website design, copy and layout.

Let’s take the example of a consulting company that targets “e-commerce companies with a revenue of 10 million dollars or more.” There are two problems with this statement:

  • The statement is too general about the target market (no verticals and no geography, for example)
  • I am not sure how to translate this statement into actionable items on my website or marketing activity

You should first think about the actual person who would hire the services of this consulting company. Most likely, the sales take place to:

  • A business owner for a company with annual revenue from 10 to 20 million dollars.
  • A marketing director for a company with annual revenue from 20 to 50 million dollars.
  • A VP of marketing for a company with annual revenue over 50 million dollars.

Now, translate each of these three different cases into a persona.

So, instead of talking about a business owner for a company that is generating annual revenue from 10 to 20 million dollars, we will talk about:

John Riley, 43 years old, completed his B.A. in physics from the University of Michigan-Ann Arbor. He is a happy father of three. He started the company in 2007 and financed it from his own pocket. His company generated 13.5 million dollars of revenue in 2014 and expects to see a modest 7% increase in sales in 2015. John is highly competitive, but he also cares about his customers and thinks of them as an extended family. He would like to find a way to increase this year’s revenue by 18%, but he is not sure how to do so. He is conservative when it comes to using new marketing techniques. In general, John does not trust consultants and thinks of them as overpaid.

This is an oversimplification of the persona creation process and its final product. But you get the picture. If you are the consulting company that targets John, then what type of website design, copy and visitor flow would you use to persuade him to do business with you?

What data points do you use to create personas for your website? I would start with this:

  • Market research
  • Demographical studies
  • Usability studies
  • Zip code analysis
  • Existing customer surveys
  • Competitive landscape
  • AB and Multivariate testing data

A website or a business should typically target four to seven personas.

Add Traffic Sources

So, you have the personas. These personas should impact your design, copy and visitor flow.

But how?

Let’s start by looking at analytics data. Look for a period of six months to one year and see the top traffic sources/mediums. If your website has been online for a while, then you will probably have hundreds of different sources. Start with your top 10 traffic sources/medium and create a matrix for each of the personas/traffic source/landing pages:

Now, your job is to evaluate each top landing page for each traffic source through the eyes of your website personas. For each page, you will answer eight questions.

The persona questions: Eight questions to ask

  • What type of information would persona “x” need to see to click on to the next page on the website?
  • What would be the top concerns persona “x” have looking at the page?
  • What kind of copy does persona “x” need to see?
  • What type of trigger words are important to include on the page for persona “x”?
  • What words should I avoid for persona “x”?
  • What kind of headline should I use to persuade persona “x” to stay on my website?
  • What kind of images should I use to capture persona “x” attention?
  • What elements on the page could distract persona “x”?

As you answer these questions for each of the personas, you will end up with a large set of answers and actions. The challenge and the art will be to combine all these and make the same landing page work for all different personas. This is not a small task, but this is where the fun begins.

Consider the Buying Stages 

You thought the previous work was complex? Well, you haven’t seen anything just yet!

Not every visitor who lands on your website is ready to buy. Visitors come to your website in different buying stages, and only 15-20% are in the action stage. The sequential buying stages of a visitor are:

  • Awareness stage (top of the sales funnel)
  • Research stage
  • Evaluating alternatives
  • Action stage
  • Post action

A typical buying funnel looks like this:

How does that translate into actionable items on your website?

In the previous exercise, we created a list of changes on different screens or sections of your website based on the different personas. Now, we are going to think about each persona landing on the website in one of the first four buying stages.

Instead of thinking of how to adjust a particular screen for John Riley, now you think of a new scenario:
Persona “x” is in the “evaluating alternatives” stage of the buying funnel. He lands on a particular landing page. What do I need to adjust in the website design and copy to persuade persona “x” to convert?

Our previous table looks like this now:

Next, answer all eight persona-questions again, based on the different buying stages.

Test your different scenarios

This goes without saying; you should NEVER introduce changes to your website without actually testing them. You can find plenty of blogs and books out there on how to conduct testing correctly if you are interested in learning more about AB testing and multivariate testing.

For a start, keep the five No’s of AB testing in mind:

1. No to “Large and complex tests”

Your goal is NOT to conduct large AB or multivariate tests. Your goal is to discover what elements on the page cause visitors to act a specific way. Break complex tests into smaller ones. The more you can isolate the changes to one or two elements, the easier it will be to understand the impact of different design and copy elements on visitors’ actions.

2. No to “Tests without a hypothesis”

I can never say it enough. A test without a good hypothesis is a gambling exercise. A hypothesis is a predictive statement about a problem or set of problems on your page and the impact of solving these problems on visitor behavior.

3. No to “Polluted data”

Do not run tests for less than seven days or longer than four weeks. In both scenarios, you are leaving yourself open to the chance of inconsistent and polluted data. When you run a test for less than seven days, website data inconsistencies you are not aware of may affect your results. So, give the test results a chance to stabilize. If you run a test for more than four weeks, you are allowing external factors to have a larger impact on your results.

4. No to “Quick fixes”

Human psychology is complex. Conversion optimization is about understanding visitor behavior and adjusting website design, copy and process to persuade these visitors to convert. Conversion optimization is not a light switch you turn on and off. It is a long-term commitment. Some tests will produce results and some will not. Increases in conversion rates are great but what you are looking for is a window to visitor behavior.

5. No to “Tests without marketing insights”

Call it whatever you like: forensic analysis, posttest analysis, test results assessment. You should learn actionable marketing insights from the test to deploy across channels and verticals. The real power of any testing program lays beyond the results.

If you follow the steps outlined in this blog, you will have a lot to do.

So, happy testing!

About the author: This guide was written by Khalid Saleh. He is the CEO of Invesp, a conversion optimization software and services firm with clients in 11 different countries.

Categories: 

Powered by WPeMatico

Chrome, Firefox, Safari, Opera, Edge? Impressive Web Browser Alternatives


It’s 2015 and your choice of browser has proven to be as important as your choice of operating system. Dedicated apps may be competing against browsers on mobile devices, but that is hardly the case in the desktop environment. On the contrary, each year more desktop browsers appear, and some of them can change the way you browse the Internet for the better.

Impressive Web Browser Alternatives

Google Chrome, Mozilla Firefox, Internet Explorer, Safari and Opera dominate the world’s desktop browser market. Whichever statistics you check (NetMarketshare, StatCounter’s GlobalStats or W3Counter), you’ll notice that they often contradict each other in declaring which browser is leading the race. However, no matter which method is used to determine usage share, all sources agree that those five browsers do not own 100% of the world’s desktop browser usage. They may be the most popular, but they are not the only options available for accessing the Internet. So, what about the remaining share?

The post Chrome, Firefox, Safari, Opera, Edge? Impressive Web Browser Alternatives appeared first on Smashing Magazine.

Chrome, Firefox, Safari, Opera, Edge? Impressive Web Browser Alternatives
http://www.smashingmagazine.com/2015/09/chrome-firefox-safari-opera-edge-impressive-web-browser-alternatives/
http://rss1.smashingmagazine.com/feed/
Smashing Magazine
For Professional Web Designers and Developers

Powered by WPeMatico

On Building Digital Capacity And Attracting Talent


Traditional business logic dictates that you should outsource functions that aren’t core to your business in order to let the efficiencies of the market drive down costs. Let’s say you run a profitable magazine publishing company. You’ll probably have in-house editorial, marketing and finance teams. However, there’s little point in hiring your own cleaners because they’re not core to your business.

Companies are moving away from the old way of engaging with agencies, and towards something much more collaborative

Digital services used to be seen in this way — as a cost to be minimized by hiring external agencies that would compete with each other on price and quality. Sadly, this attitude resulted in many large organizations spending less on their digital services than they did on their restrooms, which seems crazy considering how important digital channels have become. If you equate expenditure to value, this paints a stark picture of how some traditional companies valued this sector.

The post On Building Digital Capacity And Attracting Talent appeared first on Smashing Magazine.

Powered by WPeMatico

Making Time: Redesigning A Calendar Experience For Android


In UX design, few things are more intricate than time and personal time management — only a good arsenal of mobile design patterns and information architecture principles can save you. This is the story of redesigning the UX for a popular calenda tool on Android: Business Calendar. We’ll cover designing systems, interaction design problems, scaling across screens and platforms, research, and big business decisions and their outcomes.

Making Time: Redesigning A Calendar Experience For Android

Business Calendar started out as a side project, a one-man show, and is now run by a team of eight in Berlin. The app was very successful right from the time Android entered the mainstream market, and it now has an active user base of 2 million. But instead of modernizing the design and usability regularly, the developers focused on implementing user requests and customization options.

The post Making Time: Redesigning A Calendar Experience For Android appeared first on Smashing Magazine.

Making Time: Redesigning A Calendar Experience For Android
http://www.smashingmagazine.com/2015/07/redesigning-a-calendar-experience-for-android/
http://rss1.smashingmagazine.com/feed/
Smashing Magazine
For Professional Web Designers and Developers

Powered by WPeMatico

Mobile Payments: Awesome or Overhyped?

mobile-payments.jpg

So, we’re firm believers that your buyers should have several different options when it’s time to pay for their purchases. You don’t want to lose a sale just because you only take credit cards and your buyer only uses PayPal. What happens when buyers have way too many options for mobile and online payments?

The Walmart of Mobile Payments

No, really, Walmart decided to release their own mobile payment program called Walmart Pay. Who wants to play second fiddle to Apple forever? Not Walmart, that’s for sure. And with a retail app that boasts 22 million active users, a mobile payment option seems like the right way to go, right? If buyers are on board enough to download and use your app, then they’re probably all in on the payment options, too. 

Well, buyers weren’t quite so impressed with the Walmart Pay option. It’s not that it didn’t work or that it didn’t offer a viable payment solution. Buyers simply had their payment plans worked out already. Why make the switch from the payment option they’d always used just because Walmart introduced something new?

Apple’s Not So Awesome, Either

We know that 4.9% of Apple Pay eligible sales were actually paid with Apple Pay during the holiday shopping period of 2014. It was new technology, and surely the idea would eventually catch on. That optimism should have led to a higher number of Apple Pay purchases on Black Friday and Cyber Monday, but it didn’t.

This year, during the holiday shopping period, Apple Pay eligible transactions actually almost halved. Instead of growing, only 2.7% of eligible sales were completed through Apple Pay. Isn’t this supposed to be the answer to all online sales? Seems consumers disagree.

Growth in Awareness and Use

With over half of online purchases made this past year on mobile devices, it’s obvious buyers love the convenience of mobile shopping. Of those buyers, 52% only recently realized that their phones could be used as a payment device. Did they jump immediately into using Apple Pay or another mobile payment option?

Nope.

Since its introduction, the use of mobile payment has only increased by 1% year over year. That’s a pretty clear sign that consumers just aren’t that into it. What’s not entirely clear is why buyers have been slow to adopt mobile payment options.

What Would Change Things?

In the face of overwhelming proof that consumers need to feel safe when making online purchases, mobile payment options consistently take that secure feeling out of the payment process. Yes, sellers need to remove as much friction as possible between the “want” and “own” stages, but some friction is necessary. When buyers don’t need to enter passwords or PINs, they may feel as though the payment process is too easy. And if it’s too easy for them, it’s easy for someone who might attempt to steal their financial information.

Then again, maybe the market is just too saturated as it is. Those who enjoy using online wallets may just stick with their years-old PayPal account, while the rest are fine entering their credit card information any time they want to make a purchase. To interrupt the status quo may require a great deal more innovation than we’ve seen so far.

What are your thoughts about the slow adoption of mobile wallets? 

Learn to grow your ecommerce business with these guides.

Powered by WPeMatico

Internet Marketing Made Easy

Learn Internet Marketing Made Easy and be in the market with many other affiliates that are making money with having a business of their own. Visit the site …

The surprising reason why Coca-Cola is not the No. 1 brand on Facebook

cocacola300-204Being Liberal has 600,000 fans on Facebook.ย Coca-Cola has 65 million fans โ€” a following 100 times bigger.

Coke has an astronomical annual ad budget and marketing machine.

Being Liberal is just one guy posting content โ€” zero ad budget.

But one of these pages has 800,000 active users.ย And the other has more than 900,000 active users. Which is which, and how come?

So the question is why does the No. 1 brand in the real world not have similar brand power on Facebook?

Even Pepsi has 14 million active users โ€” 17 times bigger.

How can Mountain Dew at 8 million fans have only 26,000 active fans (one-fifth of a percent of Pepsi)?

Hereโ€™s why:

Theyโ€™re not advertising right now.

The primary metric for engagement that Facebook has chosen is PTAT (People Talking About This). Itโ€™s the number of people who have liked, commented, posted, checked-in, or otherwise generated a story on Facebook over the last 7 days.

We know itโ€™s an ad-driven metric. When General Motors wanted to get back into Facebook ads, they asked us to estimate how much auto manufacturers were spending, so they could set benchmark. Since we donโ€™t know the actual numbers, we looked at PTAT relative to total interactions to approximate ad spend.

Their reach is low.

Youโ€™ve likely heard the stat that 16 percent of fans see what you share. That average includes small business pages that have 100 fans. Itโ€™s easy to get 16 reach on 100 fans, especially if most are employees and family, but if youโ€™re a consumer packaged goods brand, your true benchmark is closer to 5 percent (2 percent if youโ€™re above 10 million fans). However, if youโ€™re a liquor brand or TV show, you can sometimes get 10 percent.

Coke posted 204 times in the last month. Assuming an organic reach of 3 percent and most of these being global posts, then theyโ€™re generating 360 million organic impressions a month.

And assuming their content is reasonably shareable, theyโ€™re getting about 10 percent extra in viral impressions. Call that 1 million more impressions a day, which is worth about $5,000 (even though most of their traffic is in Brazil).

Our buddy at Being Liberal did half a billion organic impressions last month โ€” 536,036,646, to be exact. Zero paid impressions.

We know that when you run ads on Facebook, your organic and viral reach gets a nice spike, too, and thereโ€™s nothing wrong with that โ€” itโ€™s how the game works.

On April 24, Coke hit a recent high of 1,561,594 active users on Facebook on their main page. Their all-time high was on October 7 of 2012, so they might look at what caused this and how to repeat it.

If youโ€™re look at your brand here, your highs are usually generated when all media channels are working together โ€” with TV as your biggest driver. Try trending your Nielsen ratings with your Facebook, Twitter, and website stats โ€” or we can do it for you.

Low newsfeed coverage means your fans donโ€™t see your messages, giving you the double-whammy of low engagement, too.

Most brands lost 50 percent of their impressions in September 2012, but lost only 23 percent in total interactions, since Facebookโ€™s newsfeed algorithm is doing a great job surfacing the right content.ย Read more about itย hereย from theย Los Angeles Timesย and alsoย hereย from Social Fresh.

Focusing on market share of fans, instead of engagement

Coke has 99 million fans when you include its entire portfolio of soda, juices, and other beverages.

Itโ€™s interesting that Fanta has 600,000 active users on 9 million fans. In other words, theyโ€™ve got nearly as many active users as on the flagship Coke page. What is Fanta doing differently and how can Coke make full use of their portfolio of brands?

Incidentally, Odwalla has the highest engagement rate in the Coke portfolio at 8.2 percent versus the 1.3 percent that Coke has. Weโ€™re calculating engagement rate as active user divided by fans. There are some folks who calculate engagement rate by total interactions divided by fans โ€” certainly some merit to this.

Coke is so big that it doesnโ€™t need to get more fans or awareness (in fact,ย 94 percent of the worldโ€™s population recognizes the Coca-Cola logo). Beverage industry folks talk about โ€œshare of throatโ€ โ€” that literally, Coke needs to get more liquid consumption to grow sales. Look at the waters, energy drinks, shakes, and all manner of drinks. Coca Cola producesย more than 1,000ย juice types alone. Altogether 1.7 billion servings of Coke products are consumed every day, and in 2008,ย Coke had a 42.8 percent market share. But what are things like now?

A comparison of some of the top brands of the industry is telling. Cokeโ€™s has the highest market share (percentage of total fans) on Facebook at 26.29 percent, but has only 5.8 percent of Pepsiโ€™s share of voice (percentage of total People Talking About This). This goes to show thatย a high market share does not mean a high engagement, and thatย being big is no longer enough.

The private Datalogix data you get from Facebook (if youโ€™re a major advertiser) will show you the correlation between Facebook activity and actual sales. The average is about 650 percent โ€” that you spend a dollar and get back $6.50 in sales.

This is great news. However, be careful about correlation versus causation. Yes, fans are spending more than non-fans on your products. But your most loyal customers are the ones becoming fans. Theyโ€™re not spending more BECAUSE they are fans.

Datalogix does show consumption before and after they become fans. This is better, but still confuses correlation versus causation. The only way to measure true lift is to split testโ€“ to run in test and control markets. Itโ€™s super easy to do this by uploading your email list to Facebook asย custom audiences.

Passion pages bust through the algorithm

The Mormon Church has hundreds of pages โ€” many with millions of fans โ€” organized around โ€œI Love My Family.โ€These are โ€œbumper stickerโ€ pages that people easily identify with. Just look at โ€œI fucking love science,โ€ Being Liberal, and others.

These folks get 6 times as many impressions as they do fans and have almost as many people talking about them as they have likes.

Why?

  • Theyโ€™re getting at least 10 percent of users who see their content to interact.
  • They didnโ€™t get hammered last September, when Facebook over-weighted negative feedback.
  • They donโ€™t sell, sell, sell, but have 4-5 fun posts per promotion post, or none at all.
  • They postย quality contentย 20-30 times a day โ€“ but the quality is more important than the quantity.

Even if youโ€™re not a passion brand, you can still game the News Feed algorithm by running ads to your most influential users โ€” fans or not. You can run an unpublished post to these targets, if youโ€™re concerned about overloading your fans. Another way to increase your impressions and engagement is by creating an exciting campaign that hooks peopleโ€™s emotions, like the Red Bull Stratos project. Take a look at Red Bullโ€™s interactions on some of their Felix Baumgartner posts. From the beginning of Octoberย through May 18, their top four posts (all about Felix) have more engagement than their next 18 most popular postsย combined.

Coke itself has created this kind of passion in Brazil by making cans in Brazilโ€™s national colors. Translated, the following post says, โ€œHave you found the new cans in Brazilโ€™s colors? Pedro Costa has found them.โ€ As you can see, the excitement Coke generated by appealing to the patriotic feeling of Brazil gave this postย more than 5 times the interaction than their next popular post.

But all this requires that you truly understand and segment your customers.ย You need deep analytics (not reports) that help you tune your content across all channels (not just Facebook).ย You need to see whatโ€™s working for competitors so you can mimic these techniques or at least have a solid benchmark.

If any of you have any industries youโ€™d like us to cover in more depth, just holler in the comments below!

Image courtesy of Coca-Colaโ€™s Facebook page.

The surprising reason why Coca-Cola is not the No. 1 brand on Facebook
http://www.insidefacebook.com/2013/06/12/the-surprising-reason-why-coca-cola-is-not-the-no-1-brand-on-facebook/
http://www.insidefacebook.com/tag/facebook/feed/
Inside Facebook ยป Facebook
Tracking Facebook and the Facebook Platform for Developers and Marketers