6 Ways to Make Your Posts More Actionable

action

Do you ever feel that your content just isn’t reaching your audience as well as you’d like it to?

…and that even though you’ve created something of value, it doesn’t seem like anyone’s actually taking your advice and implementing it?

I’ll let you in on a secret…

Almost every content marketer has felt this way at one point or another.

It’s difficult to create content that resonates with your readers, but it’s even more difficult to create content that inspires action.

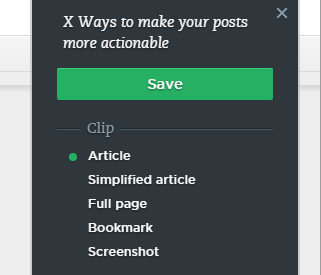
Want to make your post more actionable? Then follow these 6 ways.

And not for the reason you think. 

Yes, people are lazy. Not all, but I’d say it’s fair to call most readers in a typical audience lazy.

But still, some of those lazy people should take action, right? And most of the rest of your audience should take action too, right?

So, why aren’t they? The most likely reason is that your content isn’t actionable enough.

Content marketers talk about storytelling, copywriting formulas, and other tactics to make better content. And all of that is important.

But actionability is a concept that’s rarely talked about, and it’s enormously underrated. Actionable content is almost always great content, and it’s one of the main things you should be striving to create.

Why actionable content is difficult—but crucial—to make: The reason why it’s hard to make your content actionable comes from your inability to fully empathize with your readers.

You might write something that seems obvious to you, but it won’t be to someone with less experience in your niche.

As soon as you do that once, a reader can’t fully follow the rest of your content.

And there are a few really big consequences of this:

  1. Your reader can’t take action because they don’t know what to do. Figuring it out might be possible, but it’s quite difficult to figure out some things without some guidance.
  2. Your reader loses interest. If it’s not clear how to apply some of your advice in your content, then there’s really no point for the reader to pay close attention.

To put it simply, content that isn’t actionable is not good for the reader.

But it also sucks for you too. You put in a lot of effort to create your content, and you want readers to get the full value of what you made.

It’s disappointing when your work has no real impact.

That’s why I’m going to show the six ways you can make your posts more actionable.

If you implement most of these on a regular basis, you’ll see some great things.

All of a sudden, you’ll get comments from readers telling you how your advice helped them improve their lives in a big way. And it’s going to be one of the most rewarding parts of creating content for you.

Pay close attention, and then actually apply the tactics I’m about to show you. I made them really actionable so that you can implement them right away.

1. Use this one phrase as often as possible…

If there’s one instant change that you can implement to make your content more actionable, it’s this:

Whenever you finish giving a piece of advice, follow it up with a sentence that starts with “For example,…”

If you’ve read my posts in the past, you know that I use this phrase all the time:

image14

At first, this will take a conscious effort to do. Eventually, it will become your second nature.

The reason why it’s so powerful is because it makes it next to impossible to miss anything that requires further explanation.

For example (see what I did here?), pretend you are writing a post on building a website.

One major topic that you would include is picking a CMS.

Here’s what a snippet of your content might look like:

To make managing your website and its contents easier, you can use a simple content management system (CMS).

Next, you will need to pick a theme…

It might be obvious to you how to choose a CMS, but to someone new to the topic, it isn’t.

Let’s try that again, using our new phrase:

To make managing your website and its contents easier, you can use a simple content management system (CMS).

For example, you could choose from:

  • WordPress
  • Joomla
  • Drupal

Next, you will need to pick a theme…

I think it’d be good to go into more detail on each of the platforms, but this is already much more actionable for a reader.

Instead of having to read up on what a CMS is and what the different options are, the reader now has three good options to start with.

This quick example also illustrates that what comes after the “for example” phrase also matters. But don’t worry, I’m about to show you a few different ways you can make sure it’s as useful as possible.

2. Visuals are usually better than text

Earlier, I mentioned two main reasons why your readers don’t take action.

Some are just lazy, so you can’t really worry about them.

But the other ones just don’t have all the knowledge and guidance they need to take action. And that’s something you can fix.

To do that, we have to look at different ways readers might be missing information.

The first is they simply don’t understand what you wrote. Some things are very difficult to explain clearly in text.

Often, though, they are easy to explain with pictures.

The best example of this can be found in articles about building or baking something—anything to do with a procedure.

A simple picture can illustrate exactly what you’re talking about, like this picture in a pie recipe:

image16

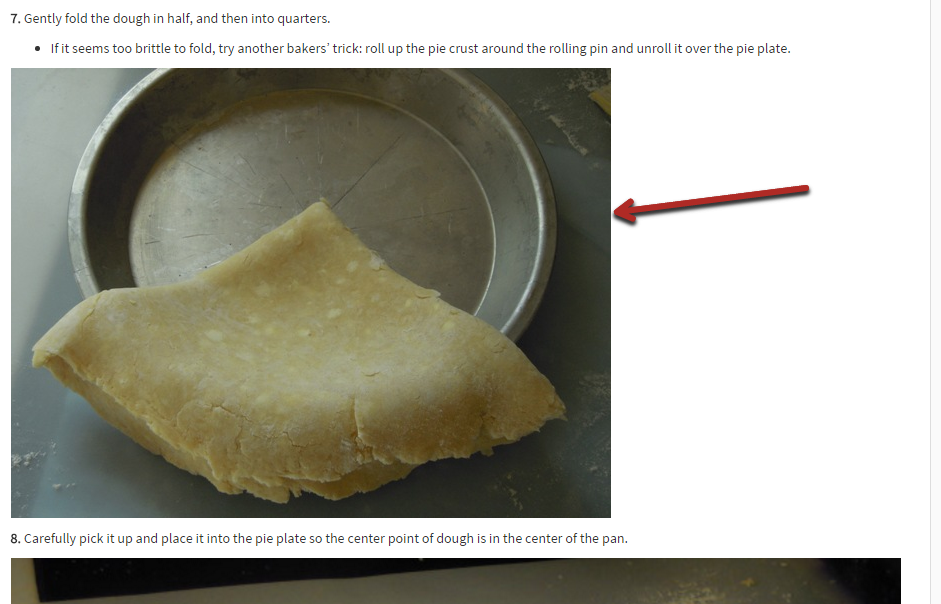
If you just explained the step in writing, maybe half of your readers would know for certain what they’re trying to do here.

But with the picture (and text), I’m sure just about everyone would understand what they need to do.

Add up that difference for the 10+ steps in the recipe, and you can see how having pictures to accompany each step makes the content as a whole much more actionable.

There’s no more guessing or uncertainty about whether the procedure would work because a reader can follow along your example.

The takeaway:

Any time you describe how to use a tool or item of any kind, include a picture demonstrating the procedure.

This is another way to make your content instantly more actionable, and it doesn’t take any special kind of genius, just an extra bit of effort.

You can create the pictures yourself or try to find some online (always give credit).

3. How is just as important as What

Any advice you give in your posts revolves around what to do.

You tell your reader what they should do to achieve certain results.

For example, I’m showing you different tactics that you can use to make your posts more actionable.

But as we talked about earlier, not all readers will be able to implement your advice just based on the “what.”

If they don’t have the prior experience and knowledge, your advice isn’t going to be all that useful.

The solution is to always provide detailed procedures of “how” to do things or to illustrate concepts.

The image tactic from the previous section may fall into this category, but there are other ways to clearly demonstrate procedures. You can use:

  • screenshots
  • gifs
  • videos
  • drawings

They all have their best uses, depending on a particular situation.

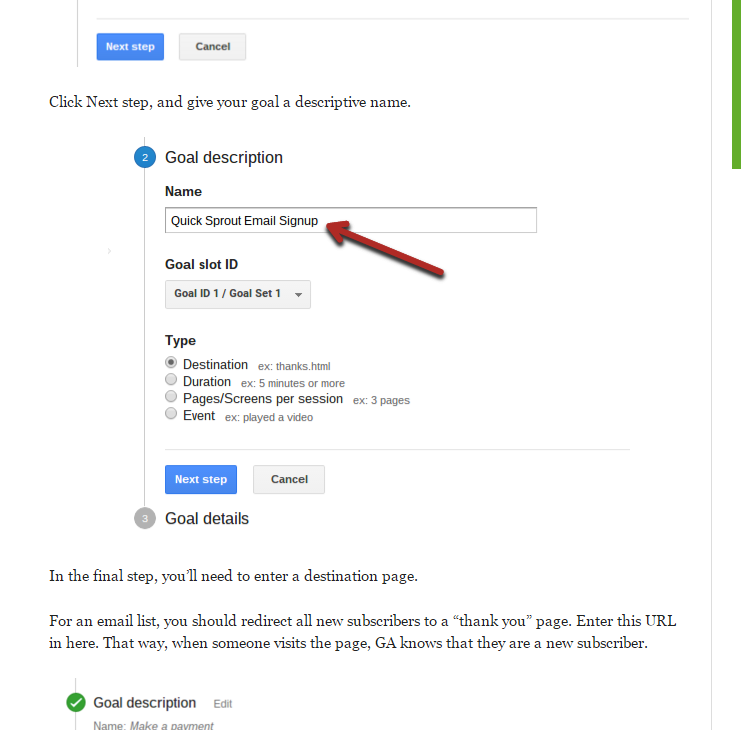
Screenshots are great for showing readers how to do a particular step on their computer.

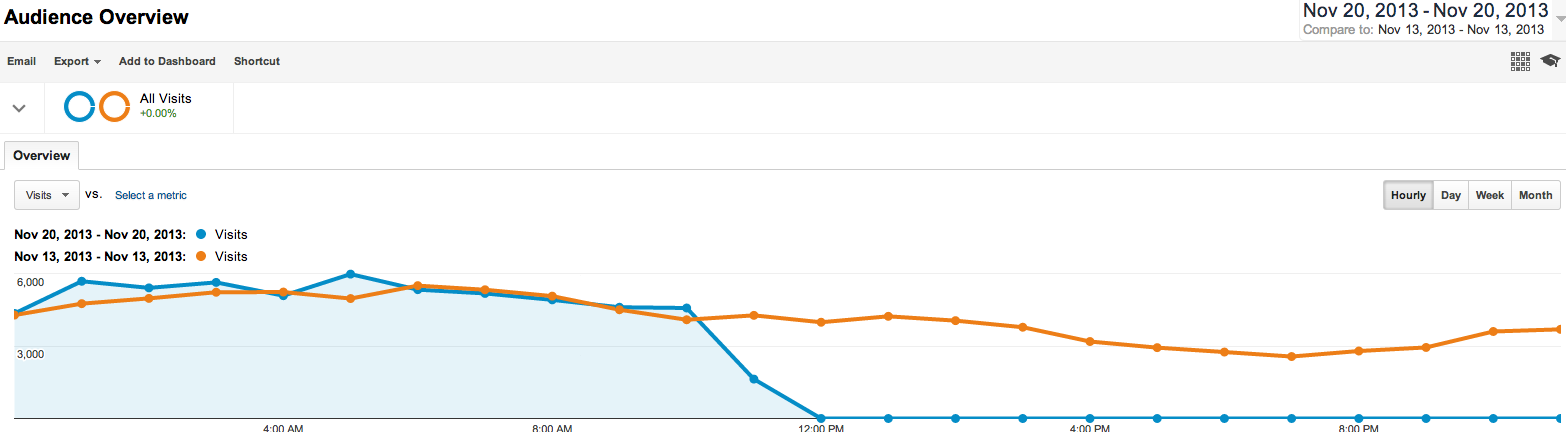
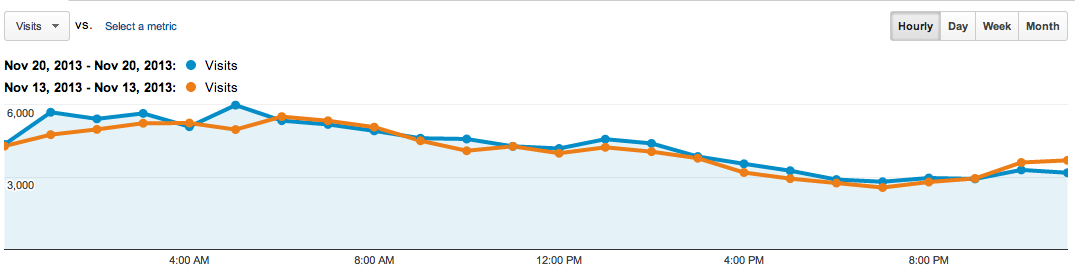
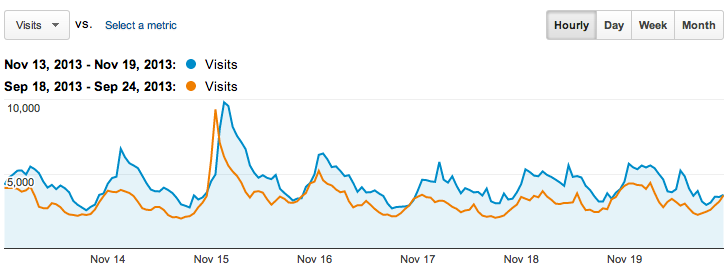
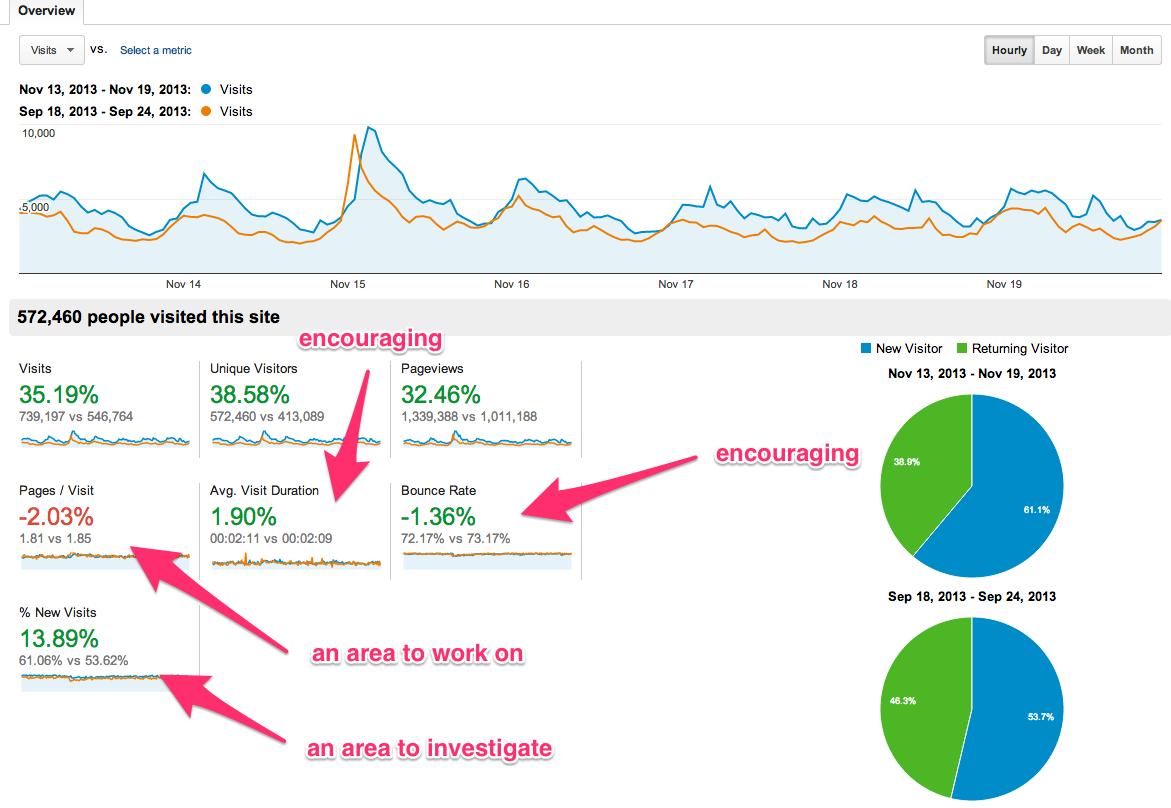
I use screenshots all the time. Here’s an example of one I included in a past article where I was showing you how to create goals in Google Analytics:

image29

In another post I wrote, I explained how to create great explainer videos because my readers might not have much experience with video marketing.

An example of a great video would help them know what to expect and what a great video looks like. I embedded it right into the content:

image00

Videos are better when you’re trying to illustrate more than just a few things; otherwise, images are easier.

The great news is that it’s really easy to embed videos.

You can find high quality video tutorials or examples of concepts for just about everything on YouTube.

Once you found a suitable video, scroll underneath it, click the “Share” button, and then click the “Embed” tab:

image07

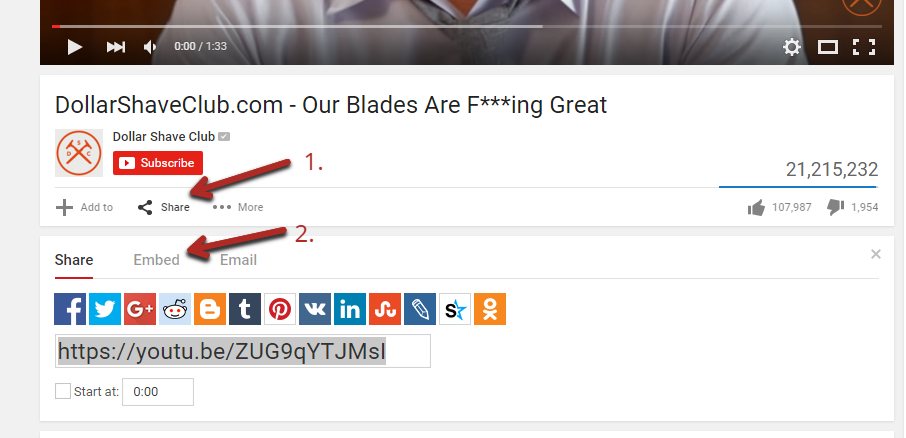
This will give you a simple iframe HTML code that you can copy and paste into your content.

image12

Finally, there are animated gifs (small clips of video without sound).

Gifs are great for a few different purposes. First of all, they’re entertaining and can make your content a lot more fun to read.

But since we’re focusing on actionability, know that gifs can be used in place of videos. At times, you might want to show a small part of a video as an example without having to embed the whole thing.

I’m going to show you in a second how you can clip a part of a video and make it into an animated gif.

Actually, I’m going to show you a few tools right now that will make creating any of these much easier.

Tool #1 – Techsmith Snagit (for screenshots and video): As I mentioned, in almost every article I write, I include annotated screenshots for the reasons we went over above.

This tool is a simple browser plugin that makes creating screenshots really easy.

To use it, click the icon on your browser (once you’ve installed the tool), which will trigger a black sidebar to pop up on the right.

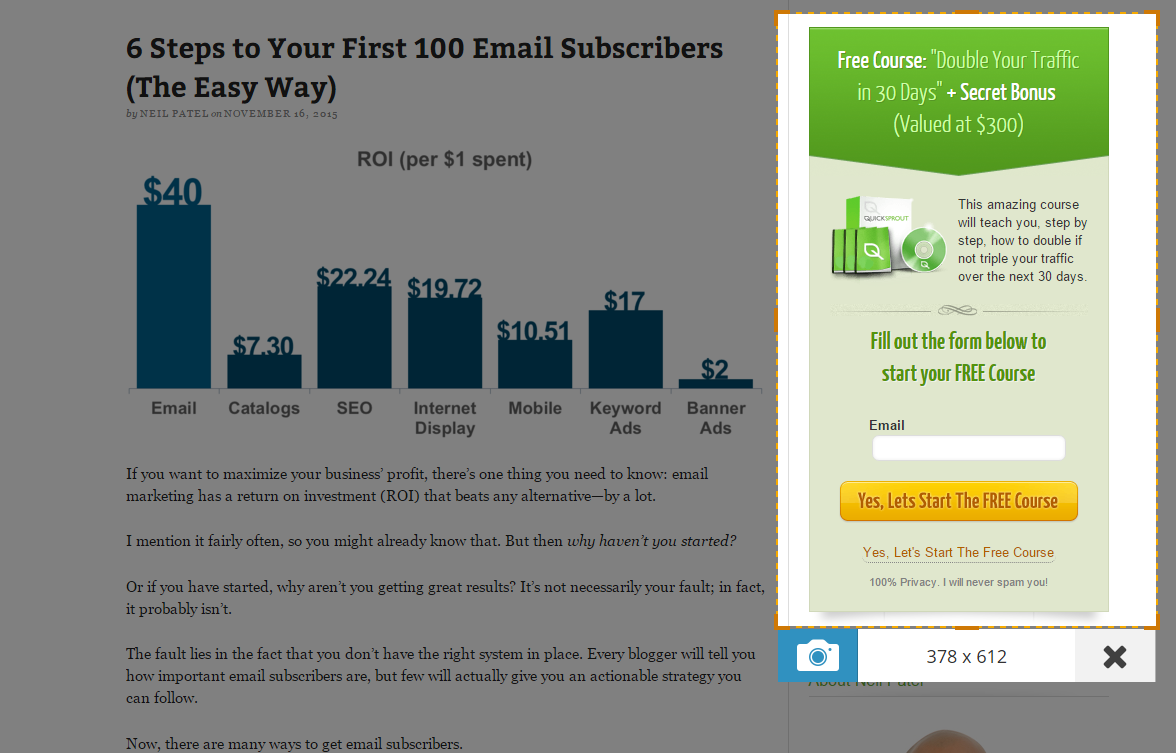
From here, you have four different options. In most cases, you’ll pick “region,” which allows you to take a screenshot of a certain part of the screen only:

image02

If you pick the “region” option, you simply drag a box around a part of your current browser screen that you want to capture. You can drag the corners to resize the box if you mess up on your first try:

image23

When it looks good, click the camera icon below the box.

That will capture your selection and open a new tab with it. Here, you can add arrows, boxes, circles, and text.

image10

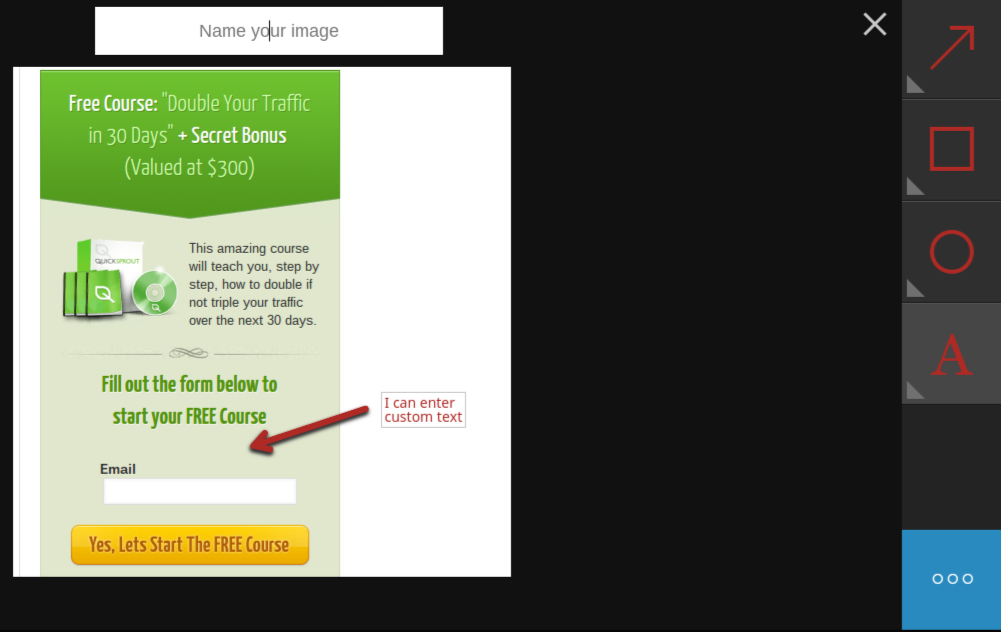
The only downside is that you have a limited number of colors to choose from, but that’s not usually a big deal.

Once you’re done annotating the image, you click the blue button in the bottom right to download the picture or get a link to it.

If you’re trying to explain a multi-step procedure, a video might be better than several pictures. In that case, choose the video option from the original black sidebar. It will capture your screen as a video until you stop it.

Tool #2 – Evernote Web Clipper/Skitch (for screenshots): Snagit is typically the simplest option when it comes to annotated screenshots. However, sometimes it’s not enough.

Sometimes, you will want a more attractive screenshot, or you want to take a screenshot of something not in your browser (like your desktop or a folder).

That’s where this second option, made by Evernote, is better.

The web clipper is again a browser plugin. When you click its icon, you’ll get a pop-up, just like with Snagit:

image06

These are the same options, just with different names.

Mostly, you’ll be using the “screenshot” option, which allows you to select a part of the screen.

One drawback is that once you select a part of the screen, you can’t adjust it. If you mess it up, you’ll have to do it again.

After you get what you like, it’ll open in a new tab where you can annotate it.

image03

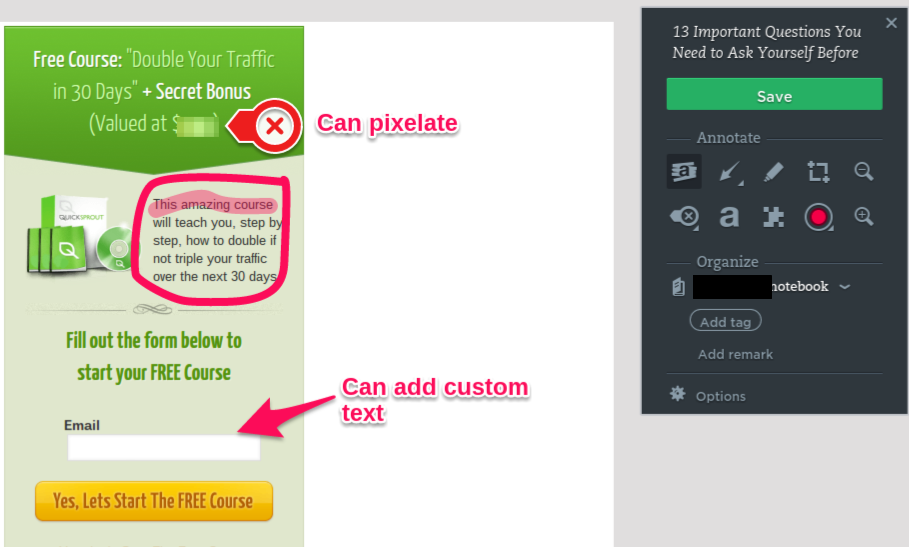
This tool has two main advantages over Snagit:

  • More options – In addition to having all the basic options, you can add labels, draw, and even blur parts of the picture.
  • More attractive – In my opinion, the arrows and other annotations look better.

Then, you can save the picture to your Evernote account and use it whenever you need it.

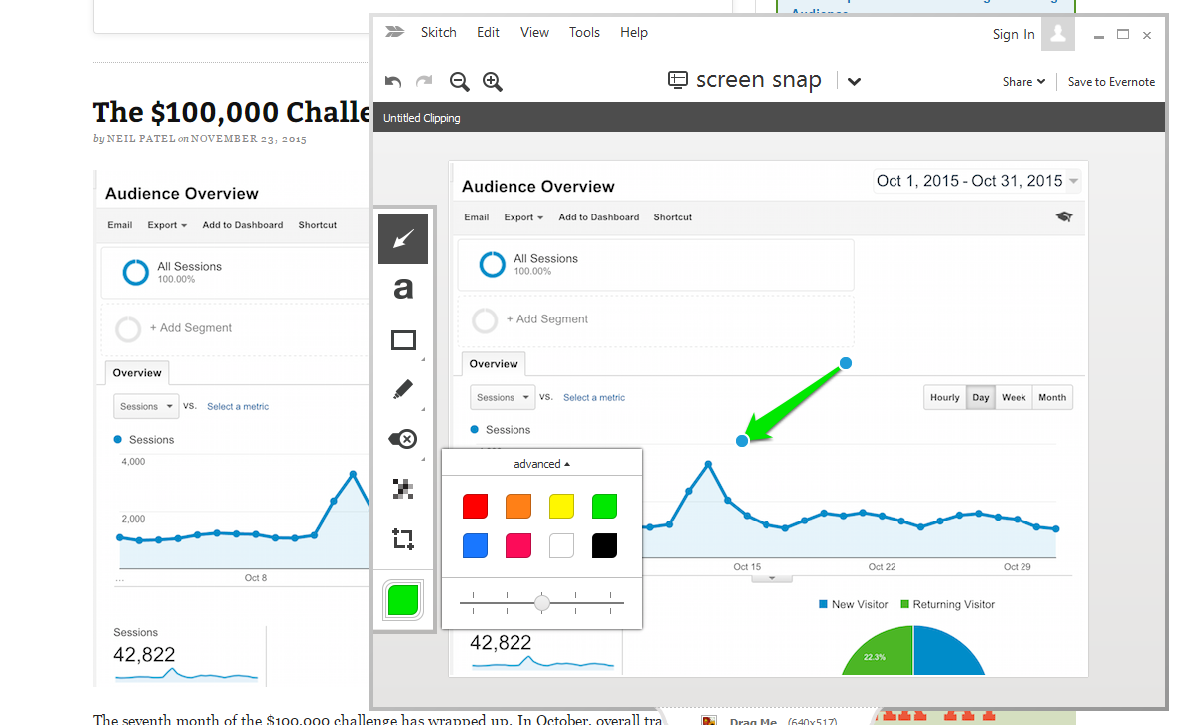
Sometimes, you’ll want to add annotations to pictures that aren’t in your browser. In that case, you’ll want to use Skitch, which is simply the offline equivalent for the web clipper that you install on your computer.

It has all the same options plus a few extra (like more colors):

image20

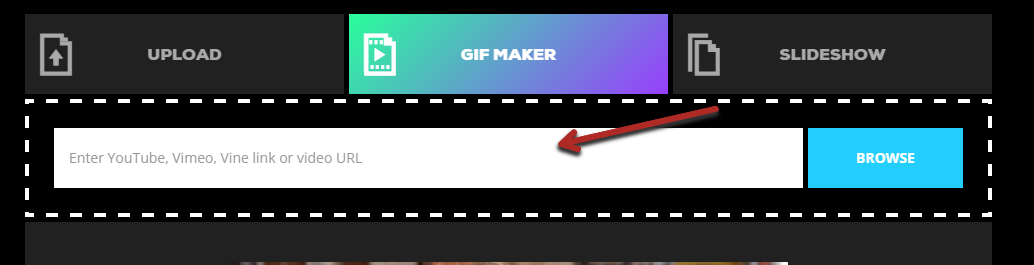
Tool #3 – Giphy Gif Maker (to make animated gifs): Very few marketers use gifs, and even fewer know how to make them.

This tool makes it easy to create gifs, and it allows you to make them straight from YouTube videos.

Let me quickly walk you through the steps.

First, you input the URL of the YouTube video (or URL from Vimeo or Vine):

image25

For this example, let’s use that video I showed you earlier in the article, the Dollar Shave Club ad.

Once you put in the URL, it will automatically load a preview of the video with a few key options:

  • start time – the timestamp in the video where you want the gif to start
  • duration – how long you want the gif to go for (from the start time)
  • caption – any text you want to display on the gif

image19

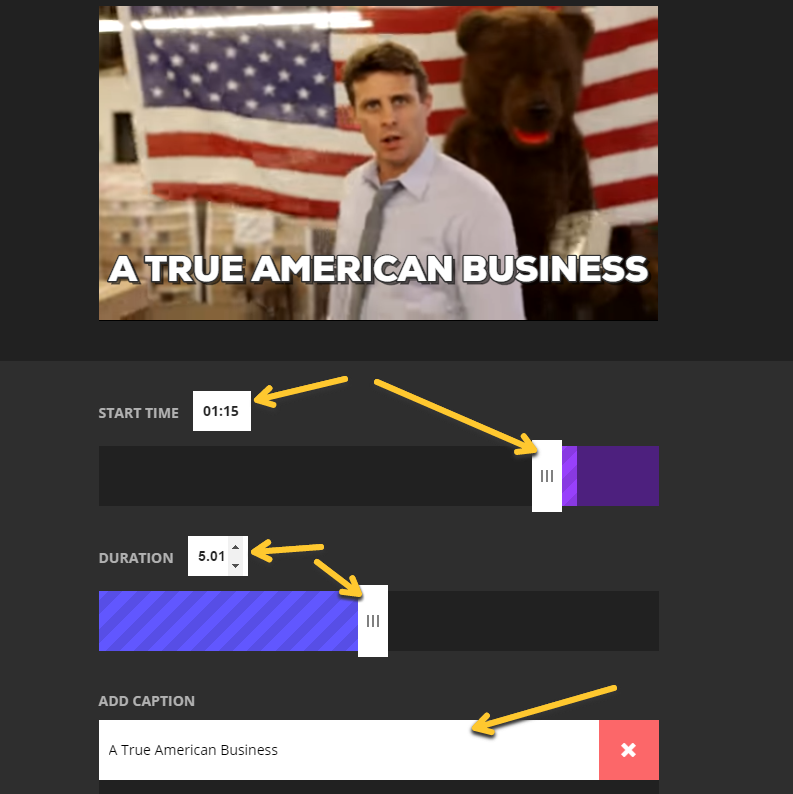
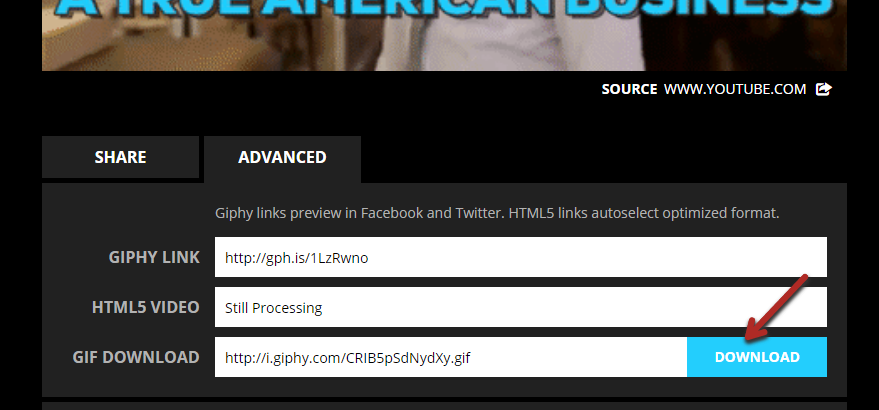
When it looks good, scroll down and click the “advanced” tab. From there, click the download button to save a copy of the gif.

image11

Finally, just upload it into your content like you would with a normal image, and voilà:

image18

You can also use Giphy as a gif search engine. Instead of making your own gif, you might one already made by someone else. Just search a few keywords.

image13

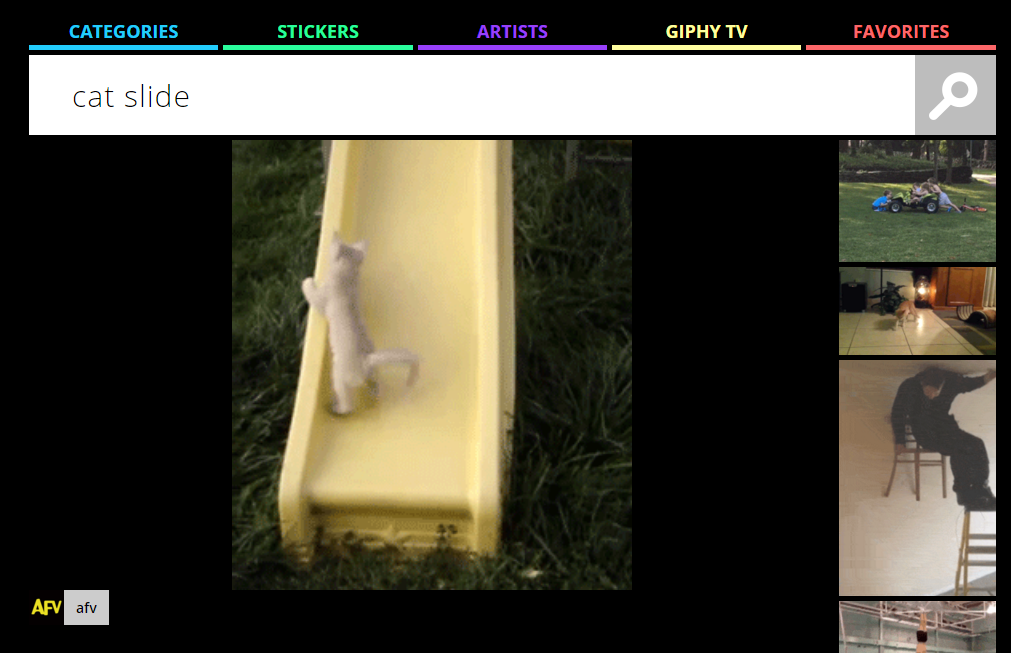
If there is a gif, you’ll likely find it.

4. Make the right things actionable

This is where things get a bit tricky…

There is a such thing as having too much actionability.

If you, by default, explain how to do every single thing you mention, your content is going to be filled with some very useful stuff and some very useless things.

While too actionable is better than not actionable enough, you want to find the sweet spot.

Let me give you a few examples of where it would be a bad idea to expand.

First, consider my example of baking a pie that I gave you earlier that illustrated how effective images can be.

Imagine if I had included a full tutorial on baking a pie. Would that add any value to my post?

No, of course not.

You don’t need to know how to bake a pie in order to understand how images can improve actionability.

That’s an extreme example so that you get what I’m talking about in general.

Now, let’s look at a more subtle example.

I often write about tools, e.g., tools that help you work as a team to create content. In these, I’ll provide tutorials on the most important functions of the tools in my list.

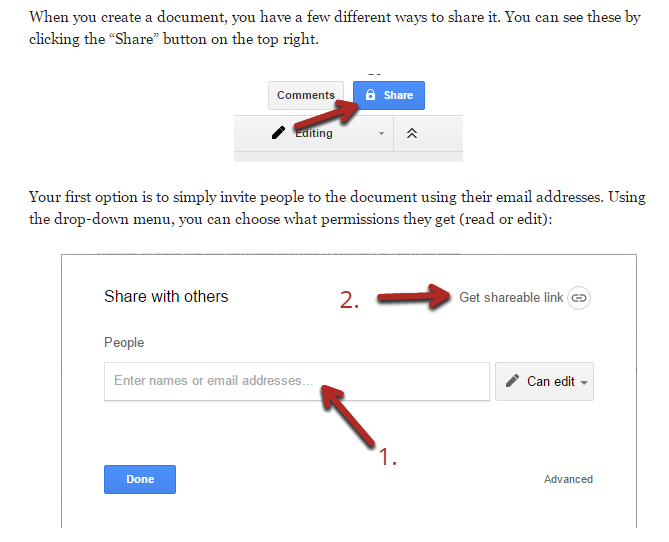
For example, here’s a tutorial of how to use the sharing function in Google docs:

image24

But Google docs has tons of features. There are probably hundreds—if you really dug in.

Should I give a tutorial for each and every one?

What about how to make tables, or format a page, or create custom bullets?

The simple answer is no, I don’t need to include tutorials for those.

That’s because only a minority of my readers would find those useful.

Even if I mention in my post that a table can be useful, that doesn’t mean I need to provide a tutorial on tables to make the post more actionable.

You want to focus on making the essential concepts you are explaining actionable, not the secondary ones.

You will have to make some judgement calls.

When you’re not sure if you should expand on a concept, ask yourself: “Do my readers need to know how to do this in order to put my advice into action?”

In the case of the Google Docs tool article, readers would have to know how to share articles with their co-workers, but they wouldn’t necessarily need to know how to create tables.

That’s the difference.

5. Calls to action can be powerful motivators

We’ve already looked at some reasons why people don’t take action when they read your content even if it has a valuable message.

One of them was not knowing what to do. But once they know that, it becomes a question of when to do it.

As you might know from firsthand experience, if we don’t do something right away, it’s very easy to forget about it and never do it.

That’s why so many readers simply bookmark articles and tell themselves that they’ll come back later and take action. Most never do.

This means that your goal is to get them to take action right then and there, while they’re reading your post (or immediately after).

To do this, you have to call out your audience. You need to explicitly tell your readers to take action and do something at a specific time.

There are two general ways to do this.

The first is to include these call-outs as instructions throughout your content.

In posts about step-by-step strategies, this works very well.

For example, here’s an excerpt from a post I published about creating a content marketing plan.

image15

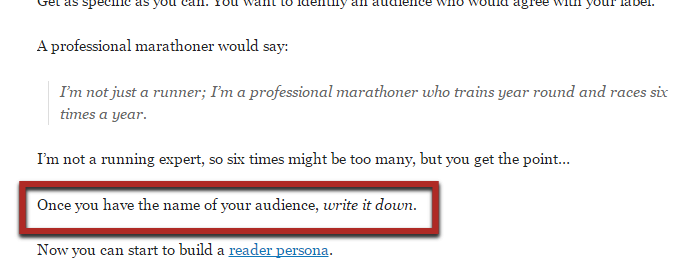
In that sentence that I put in a box, I explicitly tell the reader to take action. They’re supposed to apply the advice I just gave them about naming their audience and then take action by writing it down.

What you’ll find is that if you make that first step easy to do, you can get a lot of readers to start taking action. Then, they build the momentum, and it’ll be increasingly easier to get them to continue taking action as you move them through the steps.

Later in that article, I again urge the reader to write down a list of their readers’ problems:

image28

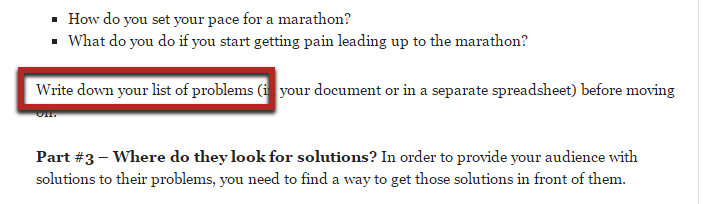
Before that point, I’ve given them all the advice they need to take that action easily.

I’m not going to go through them all, but throughout that post, I’ve broken down overall big actions into small, manageable steps at the right times.

The second approach is to put a call to action at the end of the post, in a conclusion.

This is useful for posts that aren’t necessarily step-by-step or for those cases when you need to understand all of the material before you can apply any of it effectively.

In most of my conclusions, I give next steps a reader can take:

image26

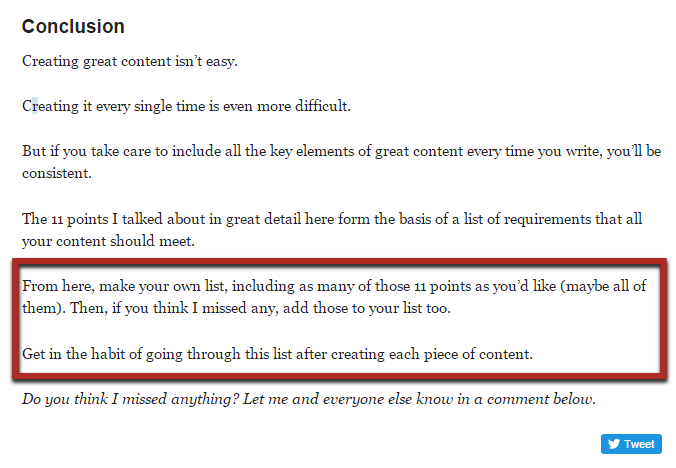
In the post I am using as an example, I specifically tell the reader to make their own list of points to include in their content and then to use it.

It’s not complicated, but it basically singles out the reader and makes it clear that the time to take action is now.

One final thing to keep in mind is that you don’t want to ask too much of your reader.

If you tell them to create a website from scratch, that’s a lot of work, and most readers won’t have time for that.

If the takeaway advice from your content is a big ask, then give them a way to make it easier.

Either tell them to start with one small piece of it, or give them a tool that helps them do it faster.

For example, in that same post, I offered a printable sheet of my 11-point content framework:

image05

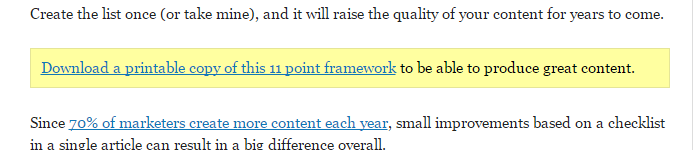
I knew it would be easier for the readers to create their plans based on my summary rather than start from scratch using the full article as their knowledge base.

6. Engaged audiences are more likely to take action

This final way of making your posts more actionable addresses the elephant in the room:

Readers are lazy.

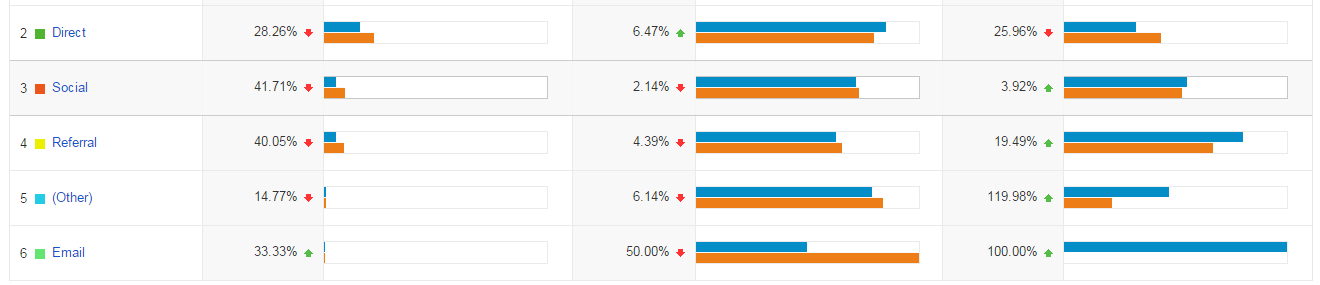
According to the 1% rule, only about 1% of forum users actually post regularly; most of them will only read, passively lurking around:

image09

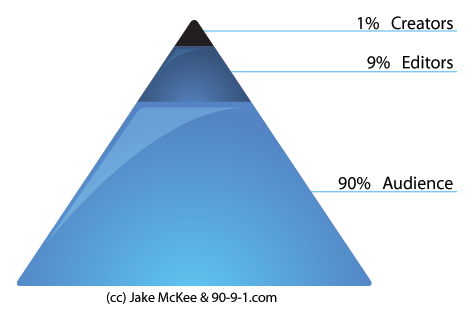
The same is true for most blogs. Most readers will skim posts but never take action.

I told you it’s difficult to get lazy people to do anything, and it’s true, but there is something you can do to encourage even lazy people to take action.

The solution is to get them to engage with the content.

That means to get them to the point when they are actively reading it, thinking about what you wrote, and taking some sort of action throughout the content.

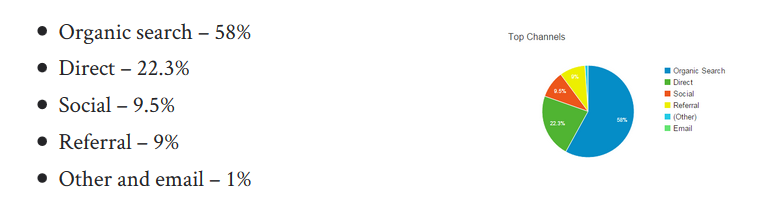
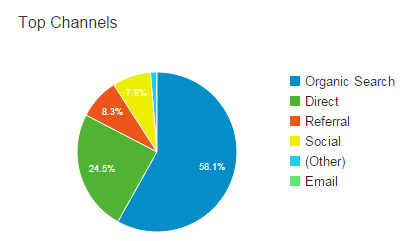
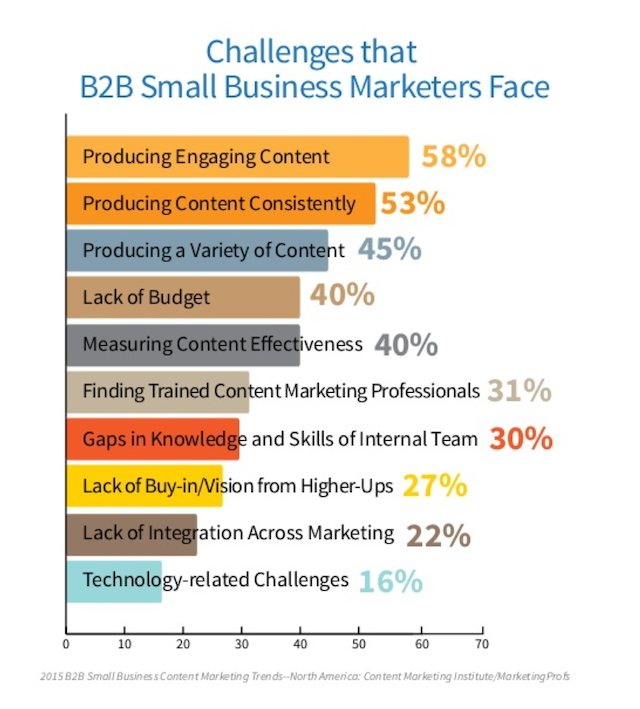
Creating engaging content is actually pretty hard. Surveys have shown that up to 58% of marketers struggle to produce engaging content:

image27

But don’t worry, I have a few easy solutions for you.

The first is a big one, and it’s using interactive content wherever possible. Interactive content describes any content with which the user can interact (shocking, I know). This might mean clicking, typing something in, etc.

The reason why interactive content leads to engagement can be seen in a recent study on university students.

They looked at different teaching methods and found that the teachers who used interactive teaching methods had an engagement rate that was double the norm and had an attendance rate 20% higher than normal.

So, on top of getting your readers focused on your content while creating some momentum so that they apply your advice, you’re also going to attract more readers in the first place.

Pretty cool, right?

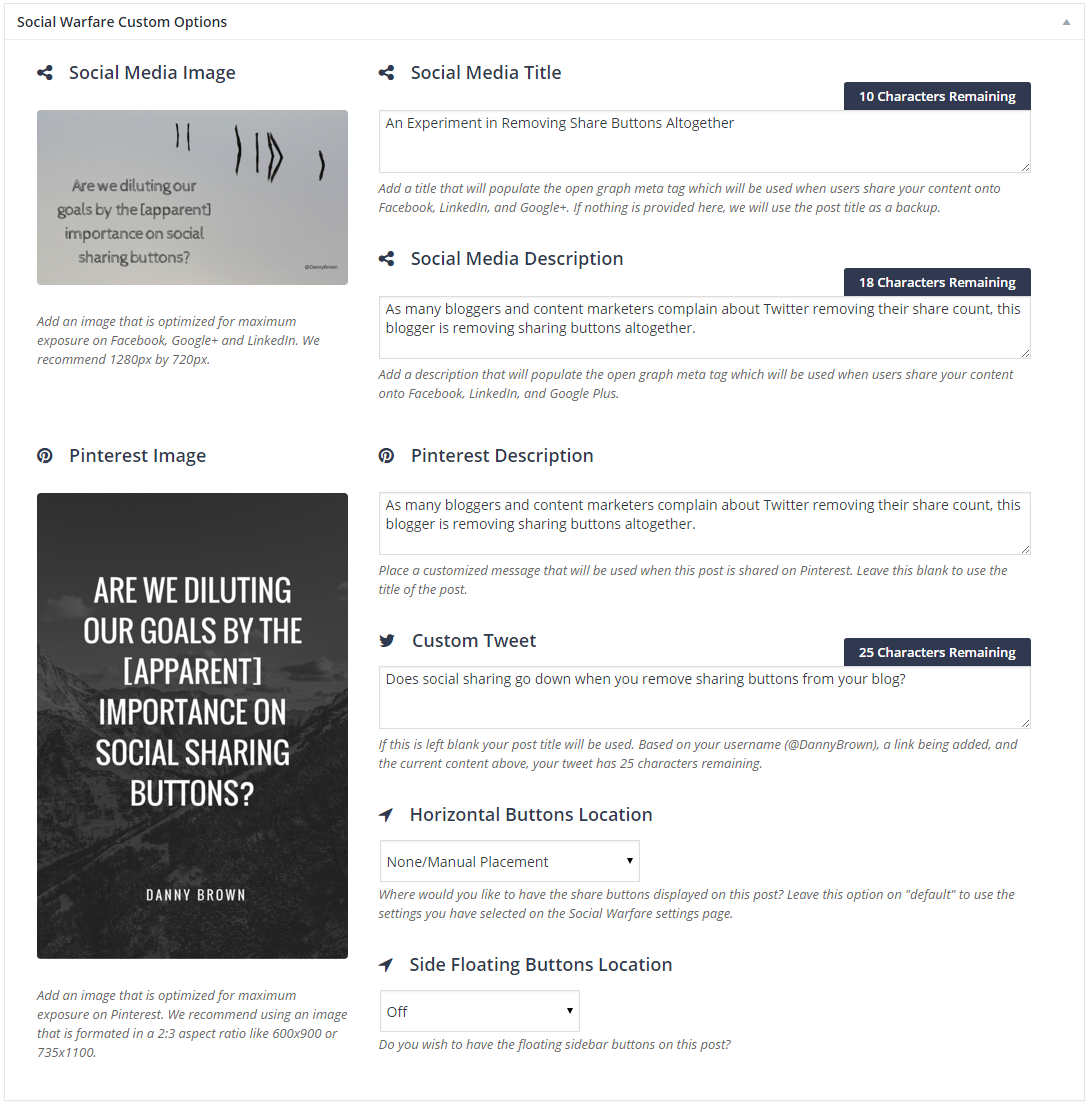
The main way you can do this is to embed social media. This breaks up the content with something different and allows the reader to take action and engage with it, leading to all those other benefits.

Embedding social media in posts: In most cases, you’ll stick to embedding tweets and Facebook posts.

While Twitter has some native embed options, I suggest using a plugin such as TweetDis, which allows you to insert attractive tweets in seconds.

If you buy TweetDis, once you install it, you’ll see an icon in all of your post editors:

image01

In order to use it, highlight the text you want to be tweetable, and then click the icon.

The resulting pop-up has a few simple options.

image08

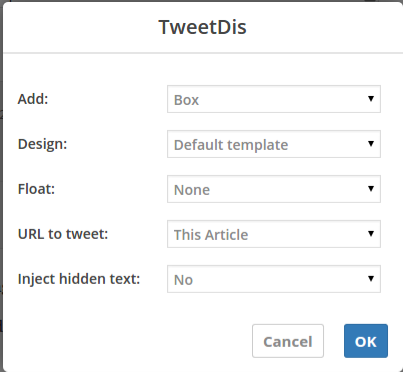
The first menu, “Add,” lets you pick the type of tweet you want. A “box” tweet looks like one that you’d see on Twitter itself, while a “hint” simply adds a highlighted link to your content that readers can tweet.

The hint is shown below:

image21

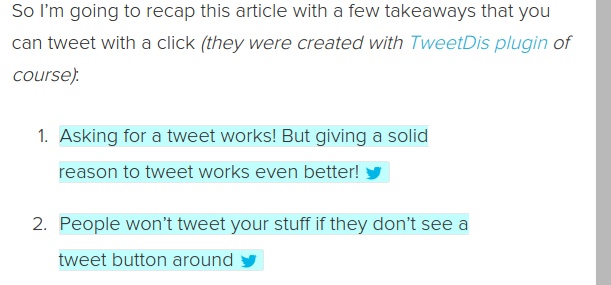
Getting the reader to switch from a passive consumption mode to an active mode (of sharing in this case) is a great way to boost engagement.

I haven’t come across any great options to embed Facebook posts, so you’ll have to do that the hard way.

If you make a post that you want to embed (or find someone else’s), you can click the drop-down arrow in the corner and choose the “Embed Post” option:

image22

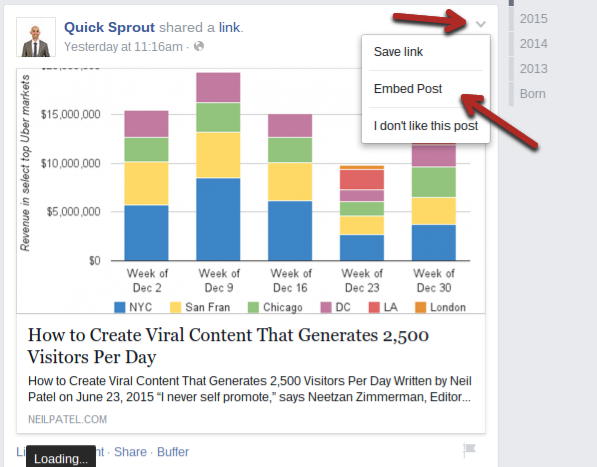
That will give you an HTML code that you can paste into your content. Then, it will show up just like a Facebook post in your content:

image04

Your readers will be able to like, comment on, and share it right from that embedded post.

There are many other ways you can use interactive content effectively, which is why I recommend reading my full guide on the topic.

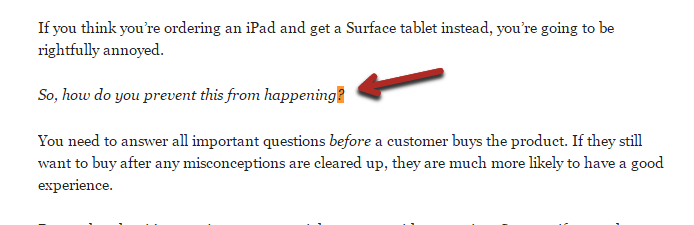
Ask questions frequently in your content: The other way to engage readers in your content is to simply ask questions.

Don’t let them just read your statements; ask them questions that make them stop and think a little bit.

I do this all the time in my posts:

image17

Overall, it makes the content feel much more like a conversation rather than a one-sided lecture.

Finally, there are two important things to keep in mind when you ask your questions:

  1. Don’t ask stupid questions – Readers will feel that the questions are out of place.
  2. Always answer your own questions – Even if most of your readers might know the answer, not all will. Answering the question yourself ensures that everyone stays on the same page.

Conclusion

If you want your content to have a big impact on your readers’ lives, you need those readers to take action.

Not only is it good for them but it’s also good for your content marketing results. Readers who experience good results from your advice will become loyal fans and, often, customers.

I’ve shown you six different ways to make your posts more actionable.

Start with one or two tactics, and once you are comfortable with them, come back and apply the rest.

I’d love it if you shared the results you’ve had from implementing any of these methods. Leave your thoughts in a comment below.

Powered by WPeMatico

207: Smartphone and Tablet Apps for Bloggers

207: Smartphone and Tablet Apps for Bloggers

Blogger Apps for Smartphone and Tablet
Today, I want to take you on a tour of my iPhone and iPad, and talk about the apps I use most in my blogging and online business activities.

One of the biggest changes that has happened in my blogging since I began back in 2002 is the technology I use. In the early days it was all done purely through my old desktop PC (and by old I mean really old) and via dial-up internet.

Things were so simple. I started on Blogger and everything that went on my blog was written directly into it. Adding images or video to my posts were not even something I considered as my internet speed was too slow and my computer not really powerful enough to do anything with them.

But since that time a lot has changed. For me, it started with an upgrade of computers (I bought myself a little white apple iBook with my first earnings) and upgrading to ADSL internet. Continue reading “207: Smartphone and Tablet Apps for Bloggers”

An Experiment in Removing Share Buttons Altogether

Sharing

Unless you’ve been hiding under a social media rock recently, you probably know about Twitter removing their share counts.

This meant that, as of November 20, any blog posts that had some form of Twitter sharing button (native or third-party) would no longer be able to show how many times that post had been shared on Twitter.

Cue content marketers and social media sharing companies decrying the move, with dramatic quotes about it “being the death of Twitter”.

#SaveOurShareCounts Tweets

Because, yes, Twitter has nothing more serious to worry about than whether or not it shows share counts…

For the rest of us, it didn’t mean as big a deal. At the end of the day, a share count is simply one metric of a blog post’s “success”.

Given there are enough shady companies and scripts out there that can artificially inflate these numbers, it’s not even a great metric.

Personally, I’d rather go by engagement, reactions (as in discussions and thoughts elsewhere), and growth (either subscribers, readers or share of voice) as metrics that matter.

But it made me wonder – with so many people getting up in arms about a little number, what would they actually feel like if you removed the option to share via on-site buttons altogether?

And so I’m going to find out.

To Quickly Share or Not to Share

Last year, I read a post from a few other bloggers who were discussing the value of social sharing buttons, and whether they helped or hindered sites.

One of the best articles I read was from Sam Solomon, called Why I’m Done With Social Media Buttons.

Sam’s main premise was from a designer’s angle, and how sharing buttons could ruin the user experience.

Yet he also shared a couple of case studies that looked at on-page sharing, and the results weren’t great.

While he admits that he didn’t do any real conversion tracking on his own site before switching off, his points around the topic are very valid, and worth the read.

His closing argument has remained with me since reading his post:

If people really love your content, they’ll share it.

And it’s true.

Yes, having on-page buttons may make it easier – but then do they take away from other calls to action that you’re trying to achieve (comments, subscriptions, etc)?

For example, this company saw conversions increase when they removed their share buttons, which is clearly a more important metric than how many tweets they got.

But perhaps that shouldn’t come as too big of a surprise – it’s simply following the golden rule of marketing: that you have one main CTA and that’s your primary KPI (key performance indicator).

You then set secondary CTAs and KPIs based on the key one – but only if they don’t jeopardize your main one.

If you take this to your blog, your core CTA might be to get a comment. Or it might be to get a subscriber. Or to download an ebook, or something similar.

I’m going to hazard a guess that these will come before social sharing. So are we diluting our goals by the [apparent] importance on social sharing buttons?

Time to find out.

Setting 30 Days Comparable Metrics

If I look at my Google Analytics, I can see how much social traffic means to my blog.

In the last 30 days, my breakdown has been as follows:

  • DB analytics chartOrganic search – 58%
  • Direct – 22.3%
  • Social – 9.5%
  • Referral – 9%
  • Other and email – 1%

Just looking at that simple pie chart, I can see that – in the grand scheme of things – social isn’t a huge part of this blog’s traffic.

While 10% might mean X amount of visits, I tend to find the bounce rate (how soon someone leaves a page) higher for social traffic than search or direct.

Additionally, if I look deeper into my social analytics, I can see that both Facebook and Twitter are the key social drivers – Twitter accounts for 31% of social traffic, Facebook accounts for 29%.

That’s almost 2/3 of all my social traffic coming from just two networks.

So, truth be told, for this particular blog, maybe social isn’t a key driver of visits, even though I’ve continuously made it easier to share with ever-improved social sharing options.

Of course, the argument could be made that perhaps the content just wasn’t shareworthy. In which case, get off my lawn! 😉

One thing I do find interesting (and another reason for this experiment) is that when I look at both my Google Analytics as well as Share Tally, I can see there are a solid number of shares from Buffer and Pocket.

These are two platforms that my current social sharing solution doesn’t support – which suggests that readers are still happy to cut and paste a blog post’s URL onto their preferred platform of choice.

Well, I guess I’m about to find out.

For the next 30 days, I’m not going to enable on-page sharing for the posts I publish.

Instead, whenever a reader enjoys a post and wants to share it, they’ll need to grab the URL and paste it directly into Twitter, or Facebook, etc.

If they do, great. If they don’t, well, maybe great, maybe not – I guess we’ll see based on traffic comparisons as well as network activity.

Either way, I’m interested to see how removing share buttons impacts the shareability of this blog.

Let the fun begin!

Powered by WPeMatico

How I use Google Analytics ‘Compare’ Feature to Motivate Me to Grow My Blog

This morning, a reader asked me this question:

“How do you motivate yourself to grow your blog traffic from day to day?”

We’ve covered a whole heap of techniques for growing the amount of traffic you attract to your blog in our Blog Promotion category (also check out this ‘how to find readers page‘ and listen to my recent finding reader webinar) but one thing that has helped me on the ‘motivation’ front lately is the report below in Google Analytics (click to enlarge).

comparing-traffic.png

What you’re looking at is the traffic so far today (the blue line) on Digital Photography School compared to the traffic on the site one week ago (the orange line) – arranged by the hour.

I’ll tell you how to get this report below but first, the reason I love this report is that it tells me whether I’m on track to get as much traffic to my site today as I had this time last week.

Having something to compare traffic keeps me motivated to better the previous week’s result.

Note: I always choose to compare traffic from exactly 1 week previous because on our site we see quite distinct rises and falls in traffic on different days of the week.

In the chart above you can see the day’s traffic started well, with the first 4 hours between 1.7% and 18.1% higher than the previous week.

This all happened while I was asleep so when I checked in at 9am I was pleased! However, I also saw that from 6am-8am that we were beginning to slip behind.

Knowing this gave me a little bit of motivation to find some ways to drive more traffic to the site today.

I took a look at the schedule of Facebook updates that I had planned for the day and decided to move a status update I thought would drive some traffic to be earlier in the day.

That status update went live at 9am and resulted in a nice bump in traffic to get the blue line trending up above the orange again.

I also identified some older posts from my archives that I then scheduled to be tweeted throughout the next 24 hours (based upon my advice from last month to promote old content), which I thought would help us to keep nudging the traffic up higher for the rest of the day.

Having this report open is a great little source of motivation to keep working not only at writing great content but also driving traffic to it.

I also find that having this comparison open during the day (and watching ‘real time’ stats) helps me to spot anomalies in traffic. It helps me to quickly spot if there’s a problem (server issues) or on the flip side it shows me when a post might have been shared on a big blog or social media account.

Knowing this information helps me to react quickly to fix a problem or leverage a traffic event.

UPDATE: here’s how the traffic looked at the end of the day in the comparison view:

Screen Shot 2013-11-21 at 8.56.20 am.png

Things slipped for the last hour or two but over the full day visitor numbers were up by 4.22%.

While a 4% increase in traffic isn’t the most spectacular result I see it is a small step in a larger race I’m running. I know if I can see even a 1% increase in traffic each week that over a year or longer that it’ll significantly grow the site over time.

How to Get This Report

For those of you new to Google Analytics here’s the easy process to get this report (it will only take you a couple of minutes).

1. Login to your Google Analytics Account

2. In the menu click on the ‘Overview’ link under ‘Audience’

Audience_Overview_-_Google_Analytics.png

3. By default you’ll be looking at the last months traffic. You want to drill down now to today so in the top right corner click on the date range and a calendar will open up like this:

Audience_Overview_-_Google_Analytics-6.png

4. Select today’s date.

Audience_Overview_-_Google_Analytics-5.png

5. Check the ‘compare to’ box and then in the new date field that opens up underneath you can put in last weeks date by clicking on the day you want to compare it to. Once you have – click ‘Apply’.

Audience_Overview_-_Google_Analytics-7.png

6. You’re almost done now. You should be looking at a report that compares the two days but by default it’ll be showing you the total of the days in the chart as two dots. You want to view this now as ‘hourly’ so hit the ‘hourly’ tab.

Audience_Overview_-_Google_Analytics-8.png

You now should be looking at the comparison of today’s traffic with the same day last week (note: your current days report won’t yet be complete unless the day is almost over and it does run an hour behind).

Variations on this report to check out

This comparison tool is really useful for a while heap of reports.

For example you can choose to compare one week with another:

Audience_Overview_-_Google_Analytics-10.png

In fact, any period of time can be compared with any other period.

Also, with a date range locked in you can drill down into many other metrics.

For example, earlier today I was doing some analysis comparing this last week with the corresponding week in September, which was just before we did our new redesign on Digital Photography School.

A day by day comparison showed a great improvement in overall traffic.

Audience_Overview_-_Google_Analytics-11.png

Drilling down further, and viewing the two weeks by the hour, was also fascinating and showed that the two weeks had remarkably similar patterns in traffic from hour to hour – so the increase in traffic was very even across the week.

Audience_Overview_-_Google_Analytics-12.png

Under that chart was some interesting data:

Audience_Overview_-_Google_Analytics-16.png

Not only were Visits and Page views well up – but being able to see that bounce rate was slightly down and that average visitor duration was up was encouraging. Seeing Pages Viewed Per Visit was down showed we have an area to improve on (we’re already working on this) and seeing that we had a good rise in ‘new’ visitors was something that should be investigated further.

To investigate the rise in ‘new’ visitors I moved into the ‘Acquisition’ menu on Google analytics. The same date range and comparison is still selected so now I’m able to compare the two periods when it comes to different sources of traffic and see why we’ve had rises in traffic:

It turns out we’ve seen increases in a few area:

Search Traffic is up:

All_Traffic_-_Google_Analytics_and_Preview_of_“Untitled”.png

Facebook Traffic is up (due to my recent experiments):

All_Traffic_-_Google_Analytics-2.png

But interestingly Feed traffic is down (giving us something to investigate).

All_Traffic_-_Google_Analytics-3.png

There are many other areas you can drill down into with the comparison tool – almost anything that Google Analytics has a report for you can compare from period to period and get a great overview of how that stat compares very quickly.

Have a go yourself – do some comparisons and let me know what you find in comments below!

How I use Google Analytics ‘Compare’ Feature to Motivate Me to Grow My Blog
http://www.problogger.net/archives/2013/11/21/how-i-use-google-analytics-compare-feature-to-motivate-me-to-grow-my-blog/
http://www.problogger.net/archives/category/blogging-tools-and-services/feed/
@ProBlogger» Blogging Tools and Services
Blog Tips to Help You Make Money Blogging – ProBlogger
http://www.problogger.net/wp-content/plugins/podpress/images/powered_by_podpress_large.jpg

So What Happens When You Remove Your Social Sharing Buttons?

winding-station-548407_1920

A month ago, I published a post about an experiment I was going to run – what happens when you remove social share buttons from your blog?

The gist of the experiment was simple: having run a bunch of tests through Google Analytics, it was clear that – as the direction of content here shifted – social was becoming less important a driver of traffic for me.

Don’t get me wrong – that’s not the same as saying social media has no value. Far from it. However, there’s a difference between being valuable and being a referral source.

Additionally, social share buttons – depending on how they’re coded – can actually hinder the experience of the visitor, especially if they’re on mobile browsers.

There was also the question of whether having share buttons took away attention from more important CTAs, or calls to action.

For example, would a sharer then not comment, or subscribe, if they’ve already taken the action of sharing a post?

To find out, I decided I’d remove sharing buttons for a month, and see what happens – and this was the result.

Removing Shares and the Percentage Impact on Traffic

In my post from last month, I shared what the breakdown was of the traffic here. From that post:

DB analytics compare

As you can see from the image above, social traffic counted for just under 10% of all traffic to this blog, with search by and far the leader.

Given that social networks can up and leave at any time, or make changes to the way they benefit bloggers and content providers, this wasn’t such a big issue for me.

Note: As my friend Jim Connolly advised, some “dark sharing” of posts on social media may not be reported as social traffic, and skew the numbers.

@DannyBrown Hi mate. Been doing some research this afternoon. Seems Google analytics still “thinks” traffic from Twitter / FB is “direct.

— Jim Connolly (@JimConnolly) December 12, 2015

While you can work in some campaign tricks in Google Analytic to overcome some of this, it’s a fair point by Jim.

So, for the results of the experiment, I’ll be comparing like-for-like on social traffic only, as defined by Google.

With that in mind, here’s the current breakdown of the 30 days of traffic since removing the share buttons.

  • DB analytics chart 2Organic search – 58.1%
  • Direct – 24.5%
  • Social – 7.8%
  • Referral – 8.3%
  • Other and email – 1%

As you can see from the previous chart, organic search remained pretty consistent at around 58%. Other and email also remained consistent.

What was interesting is the rise in percentage of direct traffic along with the decline in social traffic. Especially if, as Jim mentions in his tweet, much of that increased direct traffic is from social media.

The thinking behind that is simple: if there are no share buttons on a post, it’ll either be ignored, or the URL will be copy pasted and shared directly to a network.

Does removing social sharing buttons hinder or benefit a blog?Click To Tweet

If we think along the lines of social sharing buttons (and their ease of sharing) accounting for the social traffic in the chart, it makes sense that this section would see a decline.

However, if the increase in direct traffic is a result of manual sharing, that offers support to the argument by Sam Solomon that if people really love your content, they’ll share it.

Now, admittedly, this is as much anecdotal as it is empirical, given the way Google Analytics isn’t the greatest when it comes to slicing and dicing some of the data behind the data.

But it’s an interesting result, nonetheless, and gives a pretty good argument for anyone wondering how effective social sharing buttons are.

Removing Shares and the Actual Impact on Traffic

If the previous part of this post showed that removing sharing buttons doesn’t necessarily mean a lot percentage-wise, when it comes to actual traffic the story is a little different.

While direct is up and social is down from a percentage perspective, both have actually suffered from an actual traffic point of view, as you can see below (click image to expand).

DB analytics traffic

As you can see, there are a lot of red arrows. Given, it’s not a full 30 days since the experiment, so I’ll update this post accordingly to include this one’s stats.

Regardless, it’s clear that removing buttons does impact real traffic – which, to be fair, I was kind of expecting.

After all, if you remove the ease of use to share, there’s more likelihood something won’t be shared, as Mitch Mitchell stated over on Twitter when I first started the experiment.

@DannyBrown As a consultant, it’s never my intention to make things difficult for clients. In my opinion, you’ve made sharing more difficult

— Mitch Mitchell (@Mitch_M) December 11, 2015

Note: I’d recommend clicking through to the bigger discussion around that tweet, some great thoughts and discussion points.

It wasn’t just Mitch that wasn’t a fan of the removal of sharing buttons.

I received a few emails from subscribers, as well as messages/comments on Facebook, that suggested removal of share buttons would stop some folks from sharing my posts.

Going by the stats from Google Analytics, it’d appear that they were right. Mostly.

One thing that should be mentioned is during the experiment, I closed my Google+ account. Given this used to be my #3 social referrer of traffic, some of the lost traffic can be accredited to that.

As a final comparison in share numbers, I used ShareTally to count the overall social shares in the 30 days prior to the experiment, and the 30 days without share buttons.

This is where things got a little bit interesting.

  • With share buttons: 392
  • Without share buttons: 511

This ties back to the increase in percentage of sharing manually on social. As you can see, the posts got over 100 extra shares by not having buttons.

And yet… the actual traffic from these extra shares didn’t equate to the percentage benefits.

So, What Does It All Mean?

While there can be a few reasons for this, my own belief is this – with the sharing solution I use here (Social Warfare), I can customize the way each post is shared.

This means I can create customized tweets, encourage readers to “tweet this” with the same customized tweet, optimize images for Facebook and Pinterest, and much more.

In essence, I can make the CTA for each blog post much stronger for each of the main social networks.

As someone who crafts copy for a living, I can be a bit more creative with how the post is described, which – in turn – when shared could attract more attention.

Social Warfare optimizations

It’s not a given that this is the case, but it’s one of the reasons I believe has impacted traffic. After all, the share numbers are still there, just not the clickthrough.

So, how the post is positioned on social can mean a difference.

Keep in mind that it was the holiday period as well, and people may not have had as much interest in reading blogs.

All that aside, I was pleasantly surprised by the positive outcomes of the experiment.

  • Higher percentage of manual sharing;
  • Increase in email subscribers between the two periods;
  • Increase in on-post engagement;
  • Increase in off-post engagement.

Given that my core goal for this blog is conversations and email “conversions” (to plan ahead for less social networks), the experiment can be classed a success.

Who knew that removing sharing buttons can increase email subscribers and blog engagement?Click To Tweet

From more standard metrics – site traffic and social traffic – the experiment was a “failure”. And that’s okay.

The whole point of blogging is to experiment to see what works for you, and what enhances the user experience and what inhibits it.

  • For me, as a blogger, social sharing buttons [mostly] inhibit it (or so it would appear), given that my own goals looked to be getting met.
  • For the reader, social sharing buttons [mostly] enhance the experience – easier sharing, easier CTA, immediate optimization for sharing with their networks.

While I may yet remove sharing buttons altogether in the coming 12 months (I’m curious how the networks will play out in 2016), for now I’ll re-enable them again.

However, they’ll be pretty unobtrusive – sidebar floating as opposed to top and bottom of content for desktop readers, and removed altogether for mobile readers.

If the Social Warfare team is reading this post, it’d be great to have the option of what sharing solutions are active based on visitor. Perhaps a future addition?

In the meantime, I hope you’ve found this post useful for your own goals regarding social sharing options on your site – what are your thoughts regarding the future of social sharing?

So What Happens When You Remove Your Social Sharing Buttons? originally appeared on Danny Brown – – all rights reserved.

Powered by WPeMatico