It’s here. As of Hummingbird’s latest release (3.0) you can now integrate and control Cloudflare’s powerful APO feature straight from your Hummingbird dashboard.
A lot of awesomeness came with Hummingbird 3.0 (check out the full feature list and changelog), including an exciting new integration with Cloudflare’s Automatic Platform Optimization (APO) feature.
Why is it a big deal and how can it benefit you or your clients? You’ll find out in this article.
You’ll also learn how easy it is to activate and control this feature, right from your Hummingbird dashboard, and how using it alongside our hosting can result in even better performance.
Take your WordPress site’s performance to the next level with APO from Cloudflare.
Cloudflare’s Automatic Platform Optimization (APO) is an additional cache feature that serves all site content from their network (including 3rd-party scripts), ensuring that your site is blazing fast.
If your business depends on successful, fast loading websites, it’s hard to ignore the benefits of APO.
The best news? It now integrates seamlessly with our Hummingbird performance plugin.
It used to be that in order to handle Browser Caching and APO from Cloudflare through your site, you had to activate their plugin.
However, this new integration changes all that, and installation of the Cloudflare plugin is not needed.
It also means you can avoid a separate login to Cloudflare every time you make a change on your site.
With the new Automatic Platform Optimization integration in Hummingbird, Cloudflare can also cache dynamic content and third-party scripts, so the entire site is served from cache.
Put them all together and it’s lightning in a bottle. The best part is, both Hummingbird and Cloudflare can be used completely free.
Hummingbird’s newest release takes it from rock star to rock legend.
Before we get to activating Cloudflare’s APO, let’s first take a look at how to integrate Cloudflare with Hummingbird.
Cloudflare Integration Setup
In Hummingbird, the Integrations feature enables you to connect third-party providers to gain more control over your caching.
The first step in doing this is routing your DNS to Cloudflare, which you would do through your account on their website. Once propagation completes, your traffic is now routed through Cloudflare.
From Hummingbird’s dashboard, click on the menu item Caching, then Integrations. Click on the blue plus sign to the right of Cloudflare, under Available Integrations.
Cloudflare Integrations settings are in the Caching menu in Hummingbird.
In the popup window, enter your Cloudflare account email address and Global API Key.
Hummingbird provides a quick guide on how to locate your Cloudflare Global API Key.
If you get an error message when trying to connect, it’s likely due to recently adding DNS information through your Cloudflare account, and the settings not having propagated yet.
Give it a few minutes and try again.
Make sure you give your DNS records in Cloudflare the chance to propagate if newly added.
Now that we’ve officially joined the happy couple, let’s see what’s on the menu.
Automatic Browser Caching
Connecting your Cloudflare account through Hummingbird’s Integrations will automatically configure your Browser Caching settings.
You can adjust if needed under the Browser Caching tab by clicking the Configure link.
Get one-click configuration for your Cloudflare browser caching via Hummingbird’s integration settings.Server Type, Expiry Time, and Cache Clearing can all be handled through Cloudflare’s browser caching integrations in Hummingbird.
And now… drum roll please… away we go to APO!
Enable Automatic Platform Optimization (APO)
First things first, APO for WordPress does come with a monthly cost (see latest Cloudflare plan prices) on Cloudflare’s Free plan, and is already included in their Professional, Business, and Enterprise plans.
You can purchase the APO right from Hummingbird’s interface, click on “here” beneath the APO header (see screenshot below).
This will open a link to Cloudflare’s site, offer payment options, and take you through the checkout process. You can go directly through CF’s website for this process, if you prefer.
To enable their APO feature, you need to purchase a plan through Cloudflare.
After you’ve acquired the APO service, you can turn the Enable APO switch ON, under Automatic Platform Optimization, from Hummingbird’s Dashboard > Caching > Integrations.
Once enabled, you can also set an additional option inside to cache content, according to the device types used by your site visitors.
Cache by device type ensures only needed assets are cached and delivered to the user’s browser, depending on the device used (mobile, tablet or desktop).
Click the Re-Check Status button at any time to ensure that data displayed is up to date.
Alternatively, you can disconnect the Cloudflare integration from your site at will by clicking the Deactivate button.
Be aware that Cloudflare will still handle your browser caching, as your traffic is routed through them, but you’ll no longer be able to manage those settings from WP, and will have to do it directly through Cloudflare.
Simple one-click settings for all Cloudflare integrations are available via Hummingbird’s dashboard.
Also keep in mind that WPMU DEV’s 5-star support team is available for assistance, 24/7, should you run into any issues or questions during setup.
DJ Hbird keeps the Cloudflare party going.
(Cloud)Parting Thoughts
No matter your site’s purpose, getting and keeping optimal loading speeds is mission critical.
Hummingbird’s seamless integration with Cloudflare delivers an incomparable experience.
If you want to really blow your page loading speed out of the water, it’s worth considering a paid service from Cloudflare, and taking advantage of all that their APO offers.
Add a trusted, fully dedicated hosting solution (WPMU DEV hosting provides one of the best individual WordPress site experiences, backed by Digital Ocean), and your site can experience warp speeds.
Give it a go yourself with our 7-day free trial. You’ve got nothing to lose, and everything to gain.
If you engage the above trio, you get performance, speed, protection, and world-class support, all with the ease of a single source of input via Hummingbird’s streamlined dashboard settings.
Dynamic content naturally comes with a performance downside. In this article learn how to optimize Slider Revolution to create both beautiful and efficient animations.
Pro level visuals that look amazing and are fully responsive, can often put a damper on page speeds.
But no fear, you’ll soon see how easy it is to have the best of both worlds (the sizzle, without the slowdown) with the help of built-in Slider Revolution settings, plus our Smush, Hummingbird, and hosting tools.
Skip ahead.
Feel free to skip ahead to any of the topics we’ll be covering:
Plugins on deck are Slider Revolution (SR), Smush, and Hummingbird*.
(If you’re using our hosting, you will also have the WPMU DEV Dashboard plugin, as it’s automatically installed on sites hosted by us.)
Turn on CDN in Hummingbird
(cost associated, Hummingbird Pro)
Turn on FastCGI in the Hub
(cost associated, WPMU DEV Hosting)
Run speed tests after each of the above steps (free sites)
Particulars
The Pro versions of Smush & Hummingbird will be installed on sites hosted by WPMU DEV.
To mirror non-pro versions of the plugins, my initial tests were conducted with the Pro features disabled*.
Hummingbird optimization uses different types of caching and compression features on sites. Page, Gravatar, and RSS caching were disabled.
WPMU DEV turns on browser caching and GZip compression by default; this is standard for most hosts. These will remain on during our tests, since we can’t turn them off without impacting other settings.
As we’ve mentioned in other articles of our optimization series, please note that because of the variances inherent to each element, no one will have identical results.
Geographical locale, media library size, hosting provider – all paint part of the picture using very different brushstrokes.
No matter your particular site environment, you are bound to see marked improvement with this process.
We are going for beauty and brawn, so Slider Revolution will not only be visually stunning, but a highly functional and fast flying site.
How To Sizzle, Without The Slowdown
First up, let’s install Slider Revolution on a fresh WP site, with no other pages, posts, etc.
After installing, select a New Module from Template, from the SR dashboard. I chose “Mini Website”, which required the addition of the Particles Effect add-on.
I tweaked some settings, to personalize the content a bit. There’s so much you can play with here, I could’ve gotten lost for hours.
But on to the task at hand! A quick copy & paste with shortcode, and my landing page is revolutionized. :)
How YOU doin?
Time for our initial speed tests.
Nothing to brag about, but that’s only our base line speed.On the mid to low end, but this is pre-optimization; we’ll bring that way up.
There is currently a file size optimizer feature baked into Slider Revolution. We’ll try that and see if it gives us a bump.
Core JS and CSS are already optimized by default.
The file optimization screen lists the module’s images that can be optimized, along with a slider to make adjustments. (See SR File Size Optimizer Documentation.)
SR’s built in file size optimization offers three methods of activation.
After making some adjustments, let’s do a speed test to check for improvements.
No change from our last speed test score.A hair better than our last score.
There was a modicum of improvement with that, which we’ll follow up with some exciting news:
We have it on good authority from ThemePunch that Slider Revolution’s next version release will have built-in optimizations for Smush! (Follow ThemePunch for more on that.)
There are some overall tips and tweaks you can gain strides with, which we’ll cover a little later.
But to really enhance your site speed using Slider Revolution, you’re best served by top quality hosting, and plugins specifically designed for optimizing.
By incorporating Smush and Hummingbird, our world-class (and free!) optimization plugins, you’ll have pagespeeds humming in no time.
Let’s install and activate Smush.
Smush is our user’s choice, award winning, and benchmark tested image optimizer.
Upon navigating to the Smush dashboard, you should be greeted with the quick setup wizard. These settings include: Auto Compression, EXIF Metadata, Full Size Images, Lazy Load, and Usage Data.
Here’s what each feature does:
Auto Compression ― automatically optimizes new image uploads, so you don’t have to do each one manually.
EXIF Metadata ― strips camera settings from your images, helping reduce file size. (Don’t worry; it won’t strip SEO metadata).
Full Size Images ― compresses your original full size images. (Note: it stores copies of your originals by default, in case you ever want to revert back. This feature is Pro only.)
Lazy Load ― stops offscreen images from loading until a visitor scrolls to them.
Usage Data ― lets our designers gain insight into what features need improvement. (Your personal data will never be tracked.)
Go ahead and run through each screen, leaving default settings on. (Allowing Usage Data will help towards the functionality of future versions of the plugin, but if you have any qualms about opting in, leave it off.)
Smush is ready, willing, and able to bulk compress.
Once the wizard completes, the dashboard will reflect how many images could use compressing. Click the Bulk Smush Now button to activate her super power.
What do our image optimization stats look like now, Ms. Smush?
157 images smushed, saving 5.5 mb. Smushing like a champ!
Let’s see how much that lightened the (page) load, and do our speed tests again.
That’s an olympic jump! More than ten points.This is the kind of “B”oost you love to see.
Time to kick things into high gear, and let Hummingbird flit on the scene.
Hummingbird scans your site and provides one-click fixes to speed up WordPress in a flash.
After installing and activating Hummingbird, going to the dashboard will activate another quick setup wizard. She will suggest running a performance test, which is exactly what we want to do.
Once the test is complete, you’ll get a notification letting you know. The dashboard shows us the score from the performance test.
A score of 86 is good, but we’ll easily raise that, and our page load speeds along with it.
Hummingbird displays a list of Score Metrics that were rated during the performance test.
Your overall performance score is calculated on these listed metrics, while the pie chart represents the weight of each metric in the overall score.
For some performance issues, Hummingbird’s own features can be activated or tweaked to address them.
In other cases, Hummingbird will identify the issue, with the fix required in a separate plugin (e.g., Smush Pro).
When a plugin is not the best solution, and a bit of code editing is required, Hummingbird provides specific instructions for how to fix it.
Additional metrics called Audits separate issues into categories of Opportunities, Diagnostics, and Passed Audits.
Opportunities are basically color-coded alerts. Yellow indicates a mild to moderate issue, and Red means the issue is impacting performance to a greater degree as compared to other sites.
In this performance evaluation, Hummingbird has indicated that I have an item in Opportunities. It’s only a single instance, and not of major impact, but I am going to address it anyway.
To resolve Opportunities, click on any alert row, and it will display:
a detailed description of the issue
a list of specific assets involved
step-by-step instructions on how to resolve the issue
Opportunities for speed improvement (with detailed fixes), provided by Hummingbird.
I have nineteen Passed Audits (sweet!). Audits provide a detailed look at every aspect of your site’s performance capacity.
Even Passed Audits have explanations and fixes for each item listed. Again, this info is accessed through the corresponding row’s arrow dropdown.
Hummingbird considers Audits “passed” when the score is 90/100 or higher.
Lastly, I have three Diagnostics. These provide additional information about how your page adheres to best practices of web development.
To resolve any Diagnostics, click on the dropdown arrow to the right, under the header, and follow the instructions provided beneath How to Fix.
No googling required; Hummingbird spells everything out for you on any cited issues.
Once you’ve made all of your fixes, have Hummingbird run another performance test, so we can check score improvement.
A little birdie told me we gained six points. Huzzah!
Now we’ll do some asset optimization. From the left menu bar, choose Asset Optimization. Click Automatic, and make sure the Speedy slider is ON.
This setting not only compresses your file, but also auto-combines smaller files together, which helps decrease the number of requests made when a page is loaded.
Set your Asset Optimization to Speedy & Automatic for a performance boost.
Of note: when you’re in Automatic mode, Hummingbird auto-detects newly added plugin and theme files and optimizes them for you, but won’t remove any old files from a plugin or theme that was removed.
This is to avoid conflicts and issues, and why it’s recommended to re-check files on occasion ― so everything remains in sync.
Ok, time for some speed testing.
From the upper 70’s to the mid 80’s. Definitely making measurable gains.Better and better, on the way to best.
Awesome scores! There’s another tool we can use… let’s turn on the CDN in Hummingbird.
From the same Asset Optimization page, move the WPMU DEV CDN slider to ON (it will turn blue).
Set CDN to ON, and Crank Dat Number.
Let’s run our speed tests again.
We’re on the cusp of the 90th percentile.Don’t stop B’lieving! Performance and structure scores continue to rise.
We could finish here and be perfectly happy campers. However, I’ll throw one more log on the fire, by tweaking a setting through my WPMU DEV hosting.
Turning on FastCGI through WPMU DEV’s hosting Hub.
Bustin that move deserves a new round of test scores!
Woohoo! We’re finally in the endzone.A-maze-ing.
I think we’ve earned a victory lap!! Before I get carried away with the checkered flag, I want to share an earnest thought on continued testing.
If we were to run speed tests randomly going forward, slight variances would be expected, as none of the elements are truly static.
But barring extreme circumstances, you shouldn’t see any significant dips in page loading time, with all of the tweaks we’ve put into play.
Wheee! Slides are fun.
Making Slider Revolution(ary) Speed Gains
Slider Revolution is definite eye candy (of the designer chic variety, not bubble gum dispenser dross). Their pricing is reasonable, and tiered to the number of sites it will be used on.
If you want to make jaws drop and be remembered for powerful visuals, without giving up valuable page load speed, Slider Revolution – optimized with Smush & Hummingbird – can give you the best of both worlds.
Not only will it make an impression, but page load speeds will fly, giving your users a first-rate experience.
As I mentioned earlier, there are some components you should always consider when it comes to getting and maintaining optimal speed on your site.
They are:
Be more minimalistic in your theme design
(You can go fancy, just don’t overstuff content, taxing speeds.)
Delete plugins that are old or no longer being used
That last one can really make a night and day difference.
Make sure your hosting provider has a good reputation, and is shown to be fast and reliable. (WPMU DEV hosting plans provide solid, fully dedicated WordPress site hosting, backed by Digital Ocean.)
Quick note regarding CDN as it applies to our plugins: the settings for the image CDN are located in Smush Pro, while the web object settings are in Hummingbird Pro.
Now you can sit back and relax, while your website flies. Ah… that’s a good feeling.
Learning to build accessible websites can be a daunting task for those who are just starting to implement accessible practices. We’ve pulled together a wide range of accessibility tooling, ranging from single-use bookmarklets to full-blown applications, in order to help you get started with building more accessible websites.
ARIA
The WebAIM Million survey found that home pages with ARIA present averaged 41% more detectable errors than those without ARIA. ARIA is an essential tool for creating complex web applications, but the specification is strict and can be tricky to debug by those who do not use assistive technology regularly. Tooling can help us ensure that we are using ARIA correctly and not introducing more errors to our applications.
The Paciello Group has created a WAI-ARIA bookmarklet which scans your page to make sure all elements and their given roles and ARIA attributes are valid. Upon activating the bookmarklet, the page is scanned for any errors, and a new tab will be opened with the results. The results include the total number of valid roles, any detected ARIA errors, and code snippets of where any errors were found so that you can easily debug your page.
One thing not explicitly tested in the above bookmarklet is the presence of duplicate ARIA roles. Certain landmark roles have names that sound like they might apply to several elements, but should only be used once per page, such as banner or contentinfo. Adrian Roselli has come up with a simple CSS-based bookmarklet to check if any of these ARIA roles have been duplicated. Activating the bookmarklet will add a red outline to any offending element.
NerdeRegion is a Chrome extension that logs all the output of any aria-live regions. Can’t figure out why your screen reader is announcing something unexpectedly? NerdeRegion can let you keep track of timestamped announcements and the source element they originate from, all within a panel in DevTools. Since there can be bugs and inconsistencies with how aria-live regions are announced with different screen readers, NerdeRegion can be a great tool to figure out if an issue is potentially caused by your code or by the device combination.
Automatic Testing Tools
This class of tools can be used by the developer or tester to run automated tests on the output of your code, catching errors that may not appear obvious in the source code. There are many high-quality paid services and other tools beyond what we’ve mentioned here, but we’ve focused on tools with comprehensive free offerings in order to reduce barriers to entry. All of the listed tools can be run on pages that are not on the public internet, allowing them to be more easily incorporated into a development flow. It is important to note that accessibility testing is complicated and always requires manual testing to understand the full context of the site, but these automated testing tools can give you a solid head start.
A lot of tools use axe-core under the hood, so it may be redundant to use a combination of tools. Ultimately, what kind of tool you choose is more about what kind of UI you prefer, and the level of comprehensiveness in the results. For example, Lighthouse, the tool built into Google Chrome, uses a partial selection of axe-core rules, so if you manage to get a clean scan with axe DevTools, you shouldn’t need to run a Lighthouse scan as well.
Axe DevTools is available as a Chrome or Firefox browser extension and shows up as a panel in the developer tools. You can test a whole page or just part of a page, and all detected issues are sorted by severity and come with code snippets for easier debugging. Axe also lets you catch more errors than other automated tools with its Intelligent Guided Tests feature. Intelligent Guided Tests identify areas to test and do as much heavy lifting as possible, before asking the tester questions in order to generate a result. Axe also allows you to save and export results, which is useful for working through fixing errors as part of a longer and more cooperative development process.
Accessibility Insights also runs on axe-core, but has several features that differentiate it from axe DevTools. It can be run on various platforms, including Android, Windows, or as a browser extension. All versions of Accessibility Insights feature an inspector-like tool for looking up individual element information, as well as a way of running automated checks. The web extension also contains an Assessment feature, which has a combination of automated, guided and manual tests in order to allow you to generate a full report.
WAVE by WebAIM has been an integral part of my tool kit. Available in extension form as well as a mass testing service and an API, I find this tool best for checking my work as I develop due to its simplicity and speed. Everything is loaded as a panel on the side of your page, and you can get a holistic view of errors by scrolling through the page. If an error is displayed in the side panel but you aren’t sure where in the DOM it is, you can turn off styles to locate it within the markup. WAVE’s heading and landmark feature is one of my favorite things about it as it ensures that my document semantics are correct as I build.
SiteImprove has a free Chrome extension in addition to their paid service offerings. Like WAVE, you run the extension on a page and it lists errors in a panel on the side of the page, including filters for things like conformance level, severity and responsibility. The severity filter is especially useful as automatic testing always tends to produce some false positives.
Colors
Low contrast text errors were found on a whopping 86.4% of homepages last year. Developers often have limited control over a color palette, so it is important to try to establish an accessible color palette as early on in the process as possible.
When you’re starting to design a color palette, an in-browser color picking tool may be helpful. Are My Colors Accessible is a tool that can help you figure out an accessible color palette. The basic mode calculates the contrast ratio between any two colors. The font size and font weight of your text can affect the contrast ratio required based on the level of conformance, and this tool helpfully lays out all the different standards it meets. It also features HSL range sliders so that you can tweak any of the colors, with the results automatically updating as you make adjustments. Palette mode lets you compare every color in a palette against each other and displays the contrast ratio and standards met, which is helpful for determining how you can combine different colors together. Making any color adjustments also updates the permalink, allowing you to easily share color combinations with your team. If you prefer a different interface for selecting colors, Atul Varma has built a similar tool that uses a color picker instead of HSL range sliders.
Geenes attempts to do it all by building out full tint/shade ranges for each color group you add, allowing you to design a full-color system instead of a limited palette. In addition to providing contrast ratios, Geenes also allows you to apply your palette to various mockups, and emulate different forms of color blindness. You can trial most features for free, and unlock multiple palettes with a donation.
Certain tools can help you solve specific color-related accessibility issues. Buttons in particular can be tricky, as not only do you have to worry about the text color with the background color, you also need to consider the button background with the page background, and the focus outline color with both backgrounds. Stephanie Eckles’s project ButtonBuddy explains these requirements in simple language and helps you pick colors for these individual parts.
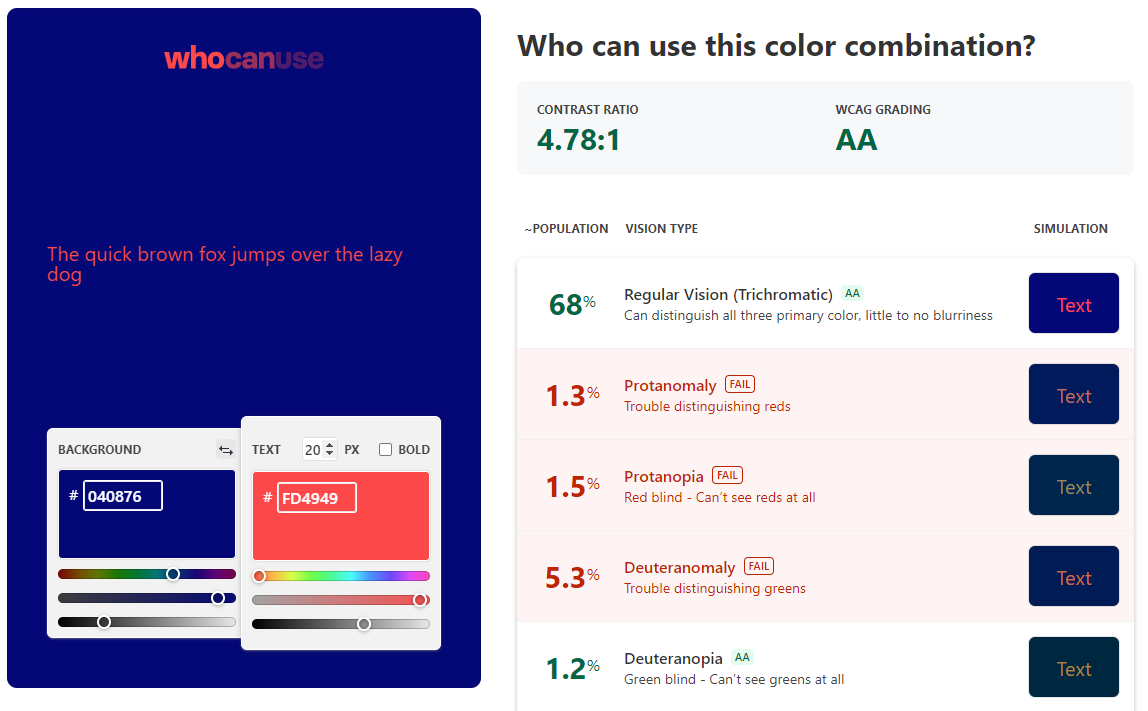
Some color combinations may technically meet contrast requirements when viewed by people without color blindness but could pose problems for specific kinds of color blindness and low vision. Who Can Use applies a visual filter to emulate different types of color blindness and then calculates an approximate color contrast ratio.
If you would like to test your color combinations in the context of an existing site, Stark is a color picker extension for Chrome that lets you simulate certain kinds of color blindness. Additionally, Anna Monus has created a helpful writeup of color blindness tools already built into Chrome. While this kind of emulation can never fully replace testing with real users, it can help us make better initial choices.
Sometimes as developers, we start working on a project where we may need to design as we go and begin writing code without a full, pre-established brand palette. Once development has started, it can be tedious to keep importing color palettes back and forth into external tooling. There are many options for checking color contrast within a code environment. Alex Clapperton has developed a CLI tool where you pass in two colors and it outputs the contrast ratio and passing standards right in the terminal. The BBC has published a JavaScript color contrast checker that takes two colors and determines whether or not it meets your desired standard. A tool like this can live in your codebase with your tests, or be implemented in your design system library like Storybook, PatternLab, and so on.
A11y Color Tokens takes it a step further and lets you automatically generate complementary color tokens in CSS or SASS. You pass in a color and desired ratio to generate a shade or tint of that color that meets requirements. If you need to quickly check the contrast ratio of something, Chrome and Firefox now show the color contrast information within their respective developer tools color selectors as well. If none of these tools suit your fancy, Stephanie Walter has covered many other color-related tool options in her blog post on color accessibility.
Compatibility
Building for assistive technology can often add another level of complexity when it comes to debugging. Because assistive technology is essentially another layer of an interface on top of the browser, we now need to concern ourselves with combinations of browser and assistive technology. A bug may be present in either the browser or the assistive technology, or it may be present only in a particular combination. It’s a good idea to keep this list of bug trackers on hand when trying to fix a specific issue. Some of these are public so that you can see if others experience the bug you are having, but others only offer a means to report bugs in private.
Not all browsers and screen reader combinations work well together, and not all accessibility features are equally supported across browsers. These tools can help you check if you are experiencing a bug on a specific combination of devices. HTML5 Accessibility is a list of newer HTML features and whether or not the default browser implementation is accessibly supported. In a similar vein, Accessibility Support provides a list of ARIA roles and their support in the most popular browser and screen reader combinations.
Focus Management
Managing focus is a necessary but often difficult part of making complex applications accessible. We need to consider that the focus order is logical, that focus is moved around correctly on any custom components, and that each interactable element has a clear focus style.
This bookmarklet by Level Accesslabels every focusable element on the page, so that you can check that the focus order matches the reading order. For the Firefox users out there, Firefox’s Accessibility Inspector has added this feature since version 84.
In complex codebases, where different components or third-party code might be moving focus around unexpectedly, this little snippet by Scott Vinkle can help you see what element currently has focus. If I’m struggling with the focus being moved around by other parts of my application, sometimes I also like to replace console.log with console.trace to determine exactly what function is moving the focus around.
In order to test all focus styles on a web page, we can use Scott O’Hara’s script as a starting point. Tabbing through every element can get cumbersome after a while, so a script to rotate through each element can help us make sure our focus styles look consistent and work within the context of the page.
Setting a positive tabindex to try and fix the focus order is a common accessibility gotcha. Elements that have a positive tabindex will force the browser to tab to them first. While this may not technically be an error, this is often unexpected and can cause more problems than it solves. Paul J. Adam’s tabindex bookmarklet allows you to highlight all elements that have the tabindex attribute applied.
Layout Usability
The document reading order can sometimes fall out of sync with what a viewer might expect if a layout relies too heavily on the CSS Grid or Flexbox order property. Adrian Roselli has coded up a bookmarklet for keeping track of the reading order to help you make sure your site passes the meaningful sequence guideline.
The WCAG contains a text spacing criterion where all content should still work when certain text settings are applied. To test for this, Steve Faulkner has created a bookmarklet that automatically applies the required text spacing settings to all the text on a page. Avoiding things like fixed heights and allowing for overflow not only makes your site more accessible, it ensures that whatever content you put into your site won’t break the layout, something your content editors will thank you for.
Linters are a class of tools that catch errors by scanning the source code before the application is run or built. By using linters, we can fix smaller bugs before we even run or build the code, saving valuable QA time later.
Many developers already know and use ESLint in some capacity. Instead of learning new tooling, it’s possible to get a head start on your accessibility testing by including a new plugin into your existing workflow. Eslint-plugin-jsx-a11y is an ESLint plugin for your JSX elements, where any errors will be shown as you write your code. Scott Vinkle has written up a helpful guide on setting it up.
Deque has come out with axe Linter, available as a Github app or VS Code Extension. Axe Linter checks React, Vue, HTML and Markdown files against core rules without any configuration so it is easy to get up and running, although you are welcome to pass in your own options. One helpful feature is that it distinguishes between WCAG 2 and WCAG 2.1 which is useful if you are trying to meet a specific standard.
Markup
The web is built to be resilient. If you have broken markup, the browser will try its best to patch over any mistake. However, this can have unintended side effects, both from a styling perspective and an accessibility standpoint. Running your output through the W3C HTML validator can help catch things like broken tags, attributes being applied to elements that shouldn’t have them, and other HTML errors. Deque has created a W3C HTML Validator bookmarklet based on the same engine which lets you check the markup on localhost or password-protected pages that the regular validator cannot reach.
If you’re more of a visual person, Gaël Poupard’s project a11y.css is a stylesheet that checks for possible risks within your markup. Available in both extension or bookmarklet format, you can customize the language as well as the level of advice displayed. In a similar vein, sa11y is a tool that can be installed as a bookmarklet or integrated into your codebase. Sa11y is specifically designed for looking at the output of CMS content. It displays any warnings in non-technical language so that content editors can understand and make the necessary corrections.
Reading Level
An accessible site starts with accessible content. Cognitive accessibility has been a major focus of the ongoing WCAG 3 draft and is currently mentioned in Success Criterion 3.1.5, which suggests that authors aim for content to be understandable by a lower secondary (7-9th grade) reading level.
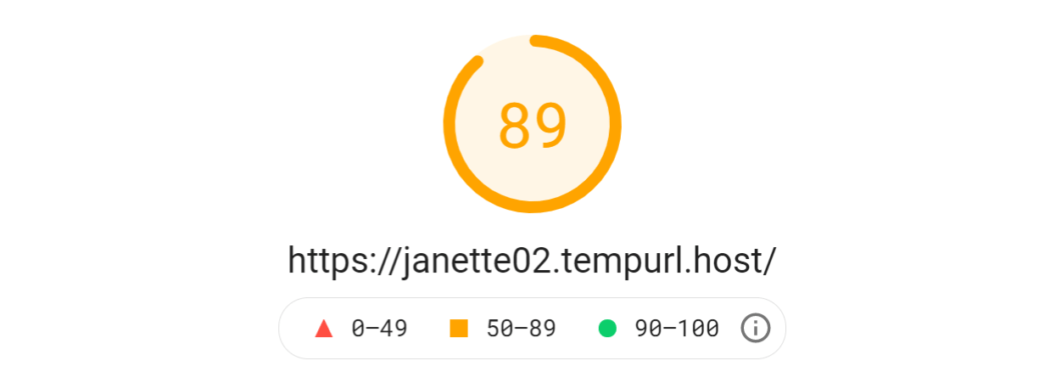
The Hemingway Editorcalculates the reading level of your content as you write it, so that you can edit to make sure it is easily understandable. The panel on the side offers suggestions for how you can improve your content to make it more readable. If your site has already been published, Juicy Studio has produced a readability tool where you pass in a URL to the provided form and your site’s content is analyzed and graded using three different reading level algorithms. There is also a helpful explanation as to what each of these scores entails. However, one limitation of this particular tool is that it takes into account all the text rendered on the page, including things like navigation and footer text, which may skew the results.
Test Suites And Continuous Integration
The downside of most automated testing tools is that they require people to run them in the browser. If you are working on a single large codebase, you can incorporate accessibility testing into your existing testing process or as part of your continuous integration flow. When you write custom tests, you have an awareness of your application that automated testing tools don’t have, allowing you to perform customized, comprehensive testing in a more scalable way.
Once again, axe-core pops up as an open-source library that frequently underpins most of these tools, so whether or not a tool works for you will likely be based on how well it integrates with your code rather than any differences in testing results. Marcy Sutton has published a framework-agnostic guide for getting started writing automated tests for accessibility. She covers the difference between unit tests and integration tests and why you might want to choose one over the other in different scenarios.
If you already have a test framework that you enjoy, there’s a high chance that there is already a library that incorporates axe-core into it. For example, Josh McClure has written up a guide that uses cypress-axe, and Nick Colley has produced a Jest flavored version in jest-axe.
Pa11y is a tool that provides a configurable interface around testing that is also available in a CI version as well. Its many configuration options can let you solve complex issues that can come up with testing. For example, the actions feature lets you pass an array of actions before running the tests and can be useful for testing screens that require authentication before accessing the page.
User Preferences
There are many new media queries to help detect the user’s operating system and browser preferences. These days, developers are often detecting these settings in order to set the default for things like motion preferences and dark mode, but this may also lead to bugs that are difficult to reproduce if you do not have the same settings.
Magica11y is a set of functions that lets you determine your users’ preferences. Send the documentation page to non-technical testers or incorporate these into your app so that you can reproduce your user’s environments more accurately.
Wrapping Up
It’s estimated that automated accessibility testing can only catch 30% of all accessibility errors. Even as tooling continues to improve, it will never replace including disabled people in your design and development process. A sustainable and holistic accessibility process might involve having the whole team use tooling to catch as many of these errors as possible early on in the process, instead of leaving it all for testers and disabled users to find and report these issues later.
Need even more tooling? The A11y Project and Stark have curated lists of additional accessibility tools for both developers and users! Or feel free to leave any suggestions in the comments below, we’d love to hear what tools you incorporate into your workflow.