Let’s talk about business models from A to Z.
One of the reasons why startups fail is because they choose an unviable business model. If you want your business to be successful, start to analyze what business model to choose from the very beginning. We want to help you with that. That is why 2muchcoffee prepared this article explaining the most successful business models and what metrics you should pay attention to if your goal is to attract more investors.
Why do You Need a Business Model?
Experts argue that it is impossible to launch a successful project without a business model. It is explained as without a clear understanding of the business goals and ways to achieve them, it will be difficult for entrepreneurs to get investments for their business. This is exactly why we need a business model.
A business model is a companies core profit-making plan. This plan defines the product or services, its target audience, the market to cover, and any expected costs.
Today there are different approaches to what counts as a business model. They can all be combined by saying that the business model should explain what demand will be met by creating a company and how this idea is better than what competitors offer.
A business model is an outline of how a company plans to make money with its product and customer base in a specific market. That’s why the model should cover the following points:
Product (what does the startup offer?);
Consumers (who needs the product?);
Marketing (how will the sales be carried out?);
Suppliers and Manufacturing;
Market (volume and type);
The presence of competitors and their features;
Method of generating income;
Costs formation system;
Non-economic factors affecting the project.
What Business Model to Choose?
To describe the structure of a business model, you can use a ready-made template (for example, Lean Canvas). However, if you decide to choose a template, it is necessary to adapt its structure to the needs of a particular business so that it can correctly convey its requirements. At the same time, the structure should be MECE (mutually exclusive, collectible exhaustive) in order not to miss any important component of the business model.
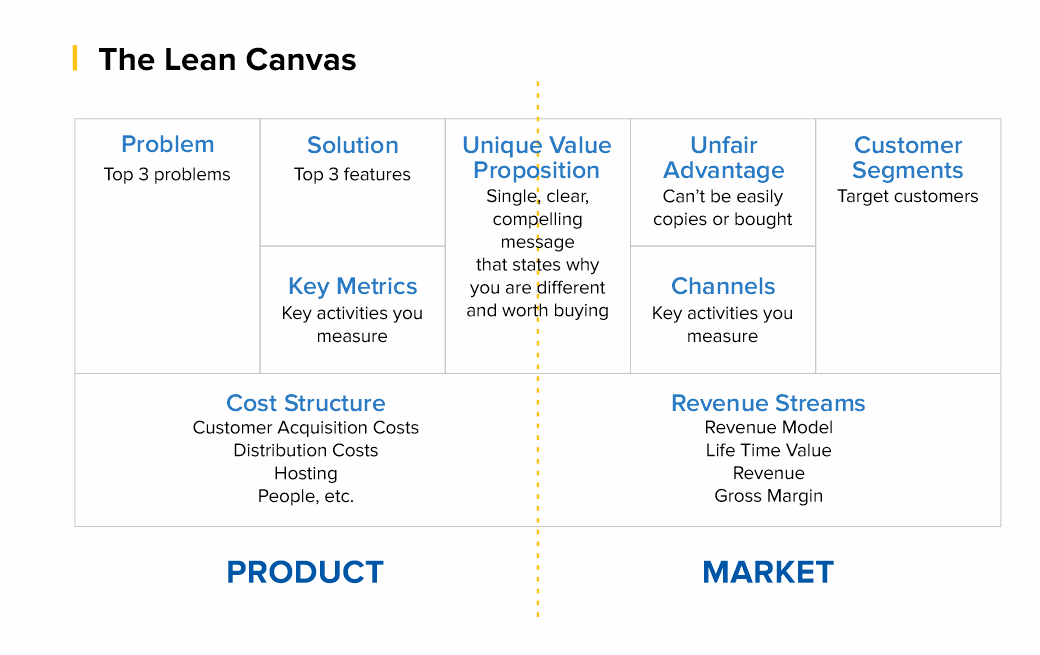
Thus, the Lean Canvas template, which was invented by Alexander Osterwalder and Yves Pignet, is a table with nine blocks, each of which is dedicated to a separate direction of business processes of the future project:
Customer Segments - Who are you creating value for and who is your most important customer.
Value proposition - what user problem you solve, what value you deliver to the customer, what package of products and/or services you provide to each segment of your customers.
Channels of interaction - how you interact with the consumer and how you communicate your value proposition to them.
Relationship with consumers - how do you interact with the client: directly, assigning a personal manager to each client, through customer self-service, through the community, through co-creation of a product, etc.
Streams of income - what value the client is willing to pay for, in what ways do you plan to monetize your product.
Key resources - what is needed for the product to be created and launched to the market, for the value of the product to be conveyed to the consumer and for the business to make a profit. Resources, for example, can be financial, material, intellectual, human.
Key activities - what needs to be done to make the business work. This can be the organization of production, distribution, search for a solution to a problem for a specific client, organization of the platform/network.
Key partners - all those thanks to whom the business functions: suppliers, dealers, support services.
Costs - what costs are needed to keep your business running.
But does everyone need to consider complex financial models in excel in order to understand whether the business will work?
The answer is no since it all depends on the complexity of the business and the stage of its development. Sometimes, simple calculations in your head are enough to understand that the model is weak to implement and the product has required some improvement.
However, if you aim to attract additional financing, you should consider the precise metrics of your business model. Investors will want to see precise metrics supplemented by qualitative analysis on the slides. To accomplish this task and provide investors with all necessary information about your product it’s important to set the right metrics.
How to Set the Right Metrics?
Usually, entrepreneurs rely on the industry vertical they are in like Healthcare, FinTech, BioTech, etc.. But this approach is wrong!
The right way to think of metrics is how do you plan to charge your users. Depending on your business idea, there are 99% that your product will fit in one of these models.
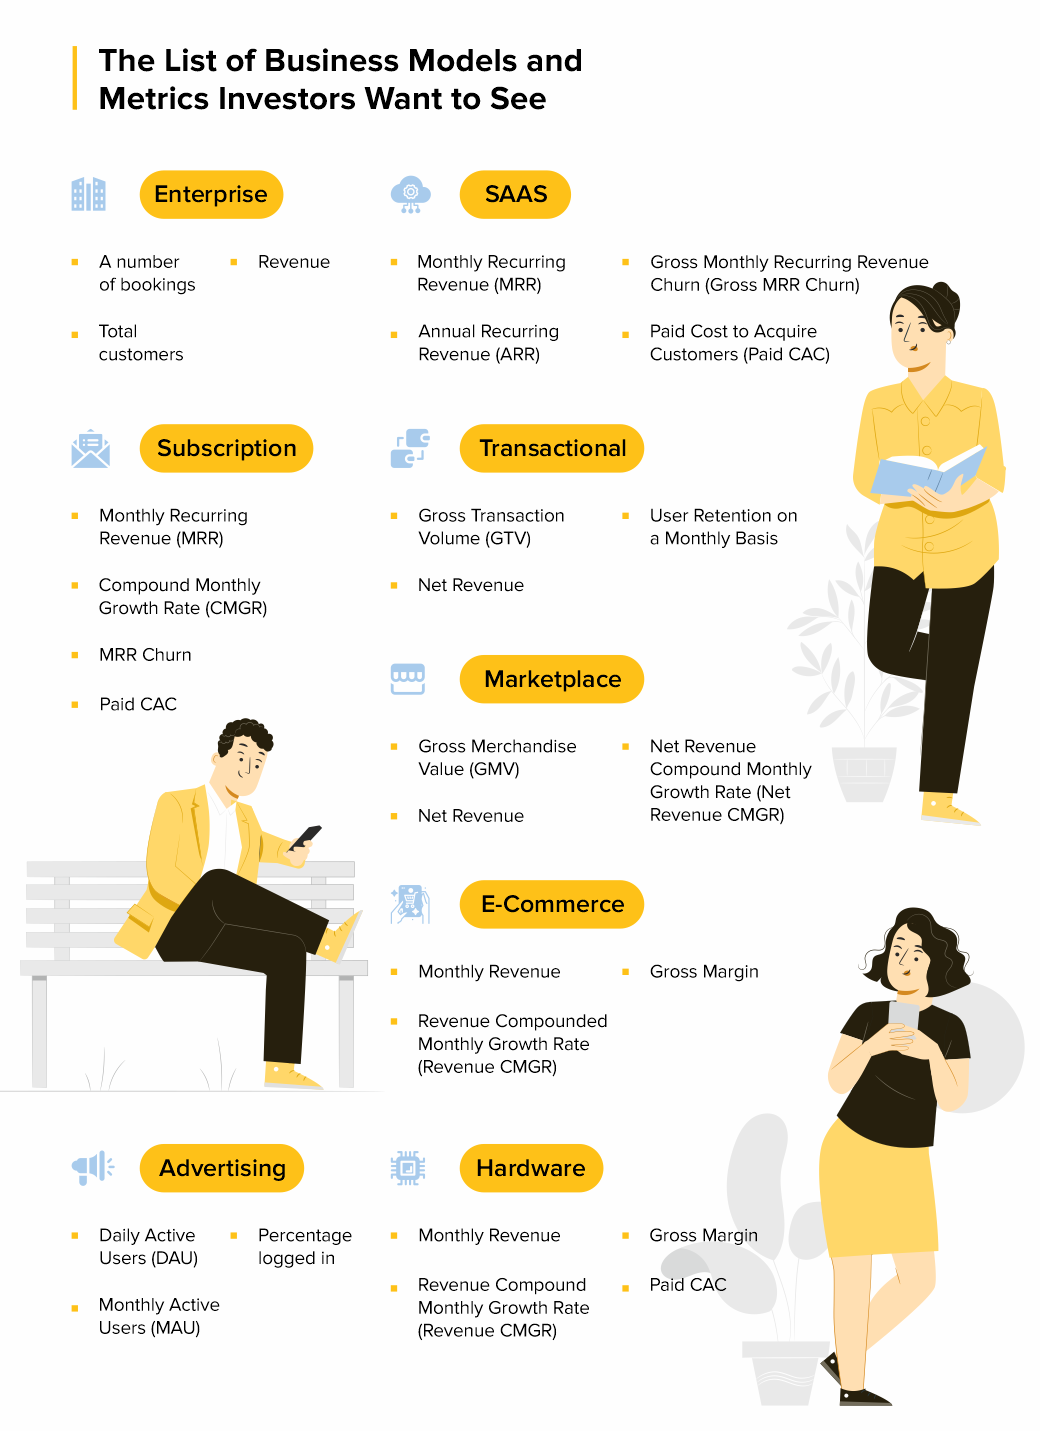
Anu Hariharan’s talk for Startup School by Y Combinator elaborates on these 9 business models and what metrics entrepreneurs should pay attention to. So, let’s discuss each of these business models and define what metrics you should be using in each case.
Enterprise
An enterprise company sells software or services to other large businesses like Facebook, Google, etc. When you work with enterprises it means you work in terms of contracts. This means it's your predominant focus from which you can frame your metrics.
Examples: Docker, Cloudera, FireEye
What are the key metrics to track?
A number of bookings meaning the total number of contracts/commitments your company has;
Total customers are the total number of unique customers that you get;
Revenue which is a value that you got after providing the required services.
Common mistakes for Enterprise model:
Confusing “Bookings” with “Revenues” and implementing contracts when working with the enterprises. The thing is, startups haven’t delivered any services unless the contract is fulfilled. So, you cannot report about the revenue since you haven’t delivered any service yet.
SaaS
The business that fits under this category sells subscription-based licenses for a cloud-hosted software solution. This model will charge users monthly for a provided software.
Examples: Mailchimp, Salesforce, Sendbird.
What are the key metrics to track?
Monthly Recurring Revenue (MRR) —— meaning that people like the product and agree to pay for the subscription every month;
Annual Recurring Revenue (ARR) shows the pace of revenue growth as compared with the absolute revenue number. This metric should be tracked in comparison with MRR, to show the annual situation of the business when it comes to subscribers;
Gross Monthly Recurring Revenue Churn (Gross MRR Churn) — pay attention to this metric if you are at the early stage of your business development and don’t have a large group of customers yet;
Paid Cost to Acquire Customers (Paid CAC) — this metric is for cases when you decide to experiment with advertising and are ready to pay to acquire users.
Common Mistakes for SaaS model:
You should not confuse ARR and ARRR and especially use them interchangeably. In this case, you won’t have a recurring revenue business if the users do not like the product and are not willing to pay for a subscription.
Subscription
A business model that is similar to a SaaS model but it usually has a lower revenue per customer. Examples of companies are Linkedin, Netflix and any other company that is usually targeting B2C, and that offers a cheaper monthly subscription affordable for every customer. The metrics are pretty much the same here as they are at a SaaS model.
Examples: The Athletic, Dollar Shave Club, Netflix
What are the key metrics to track?
Monthly Recurring Revenue (MRR) — users who are willing to pay to receive the full set of features of your product;
Compound Monthly Growth Rate (CMGR) — pay attention to this metric since quite often on a subscription-based company the subscription revenue is smaller;
MRR Churn — just like at a SaaS company this metric is important when you’re early stage and you only have a few customers, losing even one or two has a real impact on your revenues;
Paid CAC — this metric is for cases when you decide to experiment with advertising and are ready to pay to acquire users.
Common Mistakes for Subscription model:
Don’t measure CMGR as a simple average — use discrete monthly growth rates. What happens with averages? It makes your growth look good because you had some spikes.
Transactional
The type of business model that charges a fee for each transaction. For example, Stripe, PayPal, Coinbase, Brex — since these companies do use a fee from the user every time they use the product.
What are the key metrics to track?
Gross Transaction Volume (GTV) — this metric shows you that not all the volume of payments that goes through your platform is revenue. Since if you have 50 users that are going through your company processing you will have a large sum of money in total transactions, that’s GTV, but it won’t be your revenue;
Net Revenue — money that you take out of the transactions flowing through your platform, those that go into the company’s bank account.
User Retention on a Monthly Basis — due to the way of functioning of transactional businesses, you will most likely have a large volume of customers and because the customer has a high probability in gaining a lot of money, there should be no reason they stop using your platform, unless you have other problems with it that should be fixed as soon as possible.
Common Mistakes for Transactional model:
Instead of measuring CMGR as a simple average, try to use discrete monthly growth rates.
Marketplace
A type of company that acts as an intermediary between two consumers, connecting them to buy or sell a good or service. Examples of companies here include Airbnb, Ebay or Booking.com. Marketplaces connect sellers and buyers to exchange a good or service.
What are the key metrics to track?
Gross Merchandise Value (GMV) — for example if the user sets a price for a good he wants to rent or sell, from that price a percentage will go to the marketplace company.
Net Revenue is the percentage of the GMV that a marketplace company gets in their bank account.
Net Revenue Compound Monthly Growth Rate (Net Revenue CMGR). Since Marketplaces are typically B2C companies the volume of users matters that’s why you should always check User Retention because a consumer that only uses the platform once and doesn’t come back won’t help your revenue, and your company grow.
Common Mistakes for Marketplace model:
Common mistake for a marketplace business model is blending paid user acquisition with organic user acquisition. If you don’t separate out the two metrics, you won’t have a good sense if your growth will be sustainable.
E-Commerce
This is a company that sells physical goods online. Generally they manufacture and inventory those goods — a good example for this type of business model is Amazon. In e-commerce, you may make the products, but you can source the products as well — Amazon does that too with some of their products on the platform.
What are the key metrics to track?
Monthly Revenue — since there’s no recurring purchases you need to track the monthly revenue.
Revenue Compounded Monthly Growth Rate (Revenue CMGR) — measures the return on an investment over a certain period of time, and the revenue that comes from it.
Gross Margin is calculated by gross profit in a given month and divided in total revenue in the same month.
Common Mistakes for Marketplace model:
Not accounting for ALL costs that factor into Gross Profit. If you bought something and the cost is $10, a lot of companies wouldn’t include things like shipping costs, customer processing costs, and payment processing costs. If you don’t include those costs, you’re pricing it wrong.
Advertising
An advertising company is one that offers a free service, and derives revenue from selling advertisements placed inside the free service. Examples of companies that work on that model are Snapchat, Twitter, Reddit — basically platforms that are used by a high number of users, they are the most important part of your company — especially if you are early stage.
What are the key metrics to track?
Daily Active Users (DAU) — this is the number of unique active users in a 24 hour day, averaged over a period of time — the users who do not come back to your platform are not helping. You need to know how to keep them there.
Monthly Active Users (MAU) is the number of unique active users in a one month period, how many kept using your platform after day one.
Percentage logged in — users with a registered account that log in and log out over the same 30 day period.
Common Mistakes for Advertising model:
A common mistake for an advertising company is how they calculate their retention when it comes to the users they have. Some founders even forget to take that into consideration at some point and they end up regretting it.
Hardware
And the last business model that Anu Hariharan talks about is hardware which is a company that sells physical devices to consumers. Examples of such companies are Fitbit, GoPro, Xiaomi. This type of business model is really similar to the e-commerce one and that is why all the key metrics are the same.
What are the key metrics to track?
Monthly Revenue — there’s no recurring purchases, so simply track revenue per month.
Revenue Compound Monthly Growth Rate (Revenue CMGR) — since we are talking about users and tracking volume, and because averages aren’t the whole picture for this type of business you should track compounded.
Gross Margin where you need to make sure you’re making money on each transaction.
Paid CAC which is simply the average money you spend in obtaining a customer. Whatever business model your company has you should always take this matter into consideration so you can have a ROI (Return of Investment) from every action you do.
Final Words
A business model is an outline of how a company plans to make money with its product and customer base in a specific market. Choosing a business model has a key impact on a startup's success. To determine the appropriate business model template, you need to work with Lean Canvas. This will help you to go your future project through nine points devoted to various business processes. As a result, detailed information will help you choose the main business models for a startup.
The next step will be focusing on the precise metrics for your business model. These metrics should give you a clear picture of your business structure and goals to achieve. Focus on what metrics you think will be the best option for your business and go for it.
If you have any questions, please, feel free to write to us. We appreciate your feedback and will answer you in the clearest and most precise way. Consider the experienced IT consultants from 2muchcoffee to support your software development plans and business growth.